Computational multiscale modelling of failure in flax fibre composites
“My two-scale simulations could not have been performed without the use of NeSI’s HPC clusters.”
Subject:
In September 2010 and February 2011, two major earthquakes caused widespread damage in Canterbury by ground shaking and liquefaction. 185 people lost their lives and the recovery cost is estimated to be as high as NZ$40billion.
Associate Professor Brendon Bradley of the University of Canterbury, in collaboration with Rob Graves from the US Geological Survey, has used parallelised software designed for 3D seismic wave propagation simulations on NeSI’s BlueGene/P supercomputer to develop a sophisticated earthquake model which he then used to simulate all the events in the Canterbury earthquake sequence. This software uses fourth order spatial and second order temporal differences to solve the elastodynamic wave equation, and simulates wave propagations through the earth’s crust resulting from earthquakes.
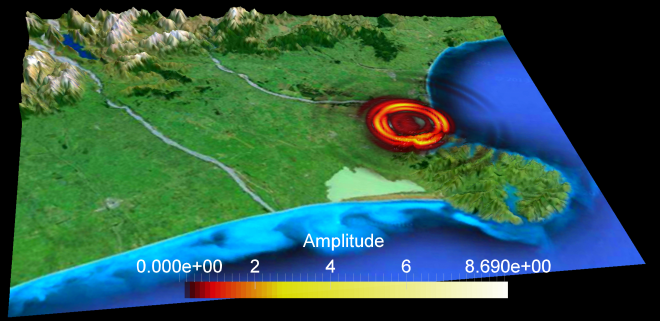
To aid understanding of output from the earthquake simulation, Dr Sung Bae from NeSI developed a visualisation workflow that converts the raw ground motion data obtained from the simulation (see Figure 2) to VTK (Visualization Toolkit) format, and visualises the ground motion on Canterbury’s 3D landscape map.

This visualisation workflow has been successfully applied to the 2010 Boxing Day aftershock simulation. The simulated result of this event contained ground motion data of 67,200 points measured every 0.1 seconds (a total of 27 million measurements). Bae then produced a 40-second long video with NeSI’s Visualisation Cluster.
Bradley’s team has recently completed the simulation of Alpine Fault scenario using 8192 cores of BlueGene/P and the visualisation workflow is expected to lead to a better understanding of future major seismic events.