Improving the treatment of heart disease
“Improving stent design by measuring the impact on blood flow may significantly reduce stent failures and ultimately save lives.”
Subject:
Biological samples of salivary cell clusters were digitised and the image slices used as the basis for a full 3D graphics model reconstruction of one cluster of cells. The 3D model was then used as a basis for simulations and visualisations.
The current study examines the structure and function of cells in the salivary gland at the microscopic level. Recent advances in microscopy techniques have enabled us to acquire the data necessary for 3D reconstruction of cell structure. We have crossed the threshold into the world of physically accurate cell level modelling, simulation and visualisation.
This work was conducted by Prof. James Sneyd and Dr Shawn Means from the Department of Mathematics at the University of Auckland, in collaboration with Prof. David Yule from the School of Medicine and Dentistry at the University of Rochester. James Sneyd is a Professor of Applied Mathematics whose specialist research area is mathematical biology and physiology – i.e. studying how body parts work. Support from NeSI for this project was led by Dr John Rugis whose expertise in computer modelling and graphics complemented the HPC compute resources that NeSI also provided.
This interdisciplinary project encompasses a range of activities targeting anatomical data-based structural modelling of individual salivary cell clusters, solution of cellular calcium dynamics function in full 3D simulations, interactive visualisation of resultant calcium waves and validation of results by comparison to experimental data. The model will be used to test duct cell function and for the testing of pathological conditions. The overall project is funded by the National Institutes of Health, USA (Sneyd, Yule).
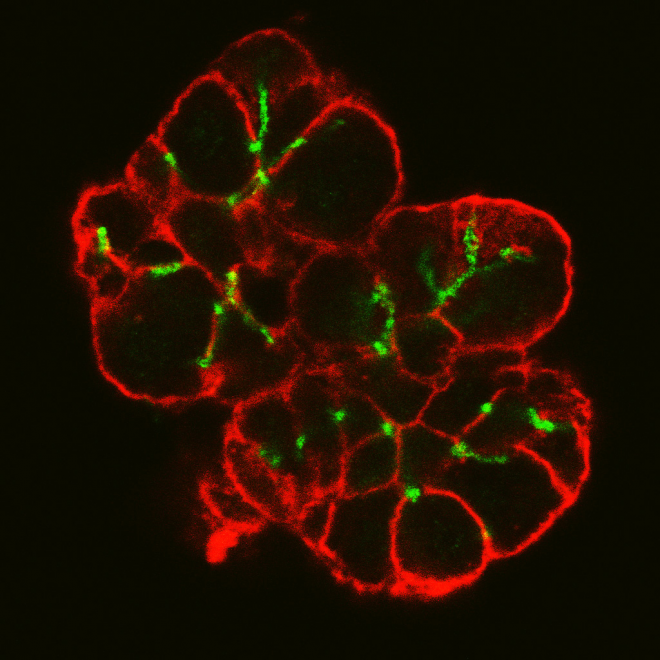
Real biological samples were digitised using fluorescent markers and confocal microscopy. A sample image slice in which individual cell outlines can be seen is shown in Figure 1. The cell membranes are colour coded red and the interconnecting lumen is colour coded green. Note that the saliva secreted from the cells is transported through the assumed tube-like lumen structure.

The full collection of 32 images was used as the basis for a full 3D graphics model reconstruction of one cluster of cells as shown in Figure 2. The tube-like structure of the lumen can now be clearly seen. This anatomically correct model was used in turn as the basis for the creation of a 3D tetrahedral mesh suitable for finite element simulations.

The same underlying 3D graphics mesh was used in the animated visualisation of the calcium concentration simulation time series results. One time series frame is shown in Figure 3.
The NeSI Pan cluster at the University of Auckland was used for both graphics model rendering and running the finite element simulations.
“The Pan cluster is an ideal platform for the application in that it will also enable us to scale up the model to include many more cells.” Dr John Rugis
As expected, simulation results for each of the cells differ somewhat. Further work will include a detailed analysis of how cell geometry affects the generation and propagation of calcium waves within each cell. We also plan to construct a larger model based on new digitisations using refined microscopy techniques.
Animation of the calcium waves within each cell