The Challenge:
Floods and inundation can be a major threat to communities and infrastructure. Current forecasting tools can predict such events but are often too slow to test many scenarios or react in real time. Visualization is a key part of both developing and running such models, to speed up debugging and produce results that are easy to understand in a timely manner.
The Solution:
Tapping into NeSI’s visualization expertise to support building a model that produces visualizations as it runs, reducing development time and making the simulation workflow faster.
The Outcome:
With an adaptive grid and an ability to run smaller-scale simulations on general purpose graphics processing units (GPUs), this model can be used as a building block for future forecasting tools, better weather analysis, and hazard management for emergency services and local councils.
According to the Ministry of Civil Defence and Emergency Management, floods are the largest hazard to New Zealand, due to their frequency, losses incurred and emergency situations caused. The Ministry estimates the total costs of flooding in New Zealand to be more than $125 million each year. Because of this, fast, adaptive predictions are needed for emergency services and local councils, to stop the destruction of property and potential loss of life.
Dr. Cyprien Bosserelle is a hydrodynamics modeller at the National Institute of Water and Atmospheric Research (NIWA) in New Zealand. He has created a numerical model for simulating inundation. Inundation is the presence of water on usually dry land – this includes flooding from rivers, storms and tsunamis.
“Right now, physics-based inundation models are too slow to be used for forecasting. You only know enough about the event to run a simulation for a couple of days beforehand, so by the time you run it, the event has passed,” said Cyprien.
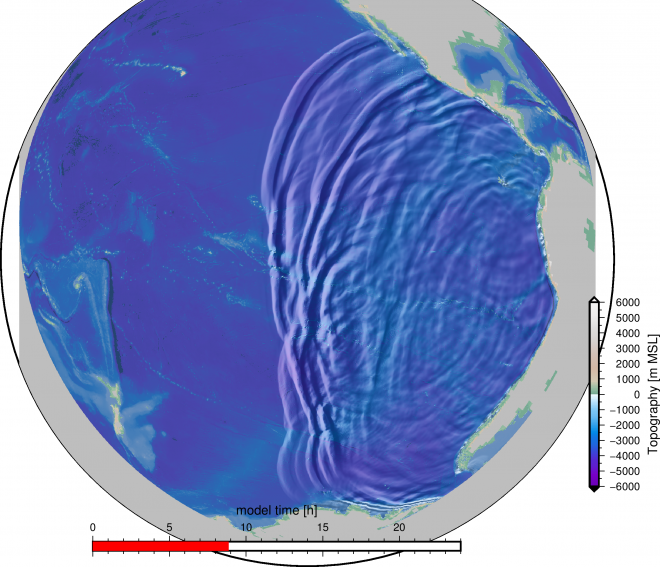
Most inundation models resolve all simulated areas with the same resolution, slowing down the program’s run-time, or rely on an engineer on-hand to work on each simulation. Cyprien’s model improved this by changing the resolution of different areas as the model runs, only resolving areas of interest.
To test his adaptive resolution, Cyprien worked with software engineer, Wolfgang Hayek, one of NeSI’s Computational Science Team members based at NIWA. Wolfgang introduced Cyprien to employ visualisation tools to enable faster testing of his model. Using the ParaView Catalyst library, it is now possible to produce images in real time while the model runs using an approach known as “in-situ visualization”.
“The algorithm creates an adaptive grid for changing resolutions. It’s a bunch of squares that change size in the computer’s memory as the simulation runs. But while testing it, I hit a dead spot. Rendering this grid in the traditional way is not trivial – it would take longer to render the result than run the model each time I wanted to find errors. I approached NeSI and we started talking about visualisation,” said Cyprien.
“The NeSI team modelled the memory itself, so the layout of the squares in that grid could be viewed directly within the model. This made my workflow easier. It allowed me to find my errors faster and improved my workflow while I was debugging.”
In-situ visualisation will also help Cyprien in the future as he expands the model. Larger models require more complex adaptive grids, so being able to view the changing memory throughout the simulation’s run will be important for keeping track of bugs and inefficiencies. The model currently works well for river and storm surges, but not for waves causing coastal flooding. This is the next step for Cyprien.
“Simulating waves is trickier than just river and storm cell inundation. Now we have a straightforward way of visualising memory, it will be useful for viewing these wave variables as it’s running,” said Cyprien.
This model will be used for hazard assessments for construction and communities. It will help inform local councils and emergency services during extreme weather events. It will allow them to decide where best to deploy first responders, when to issue weather warnings and when to evacuate areas. It can also be used to create better weather forecasting tools.
“This model is a building block for future early warning systems. It can also be used to run precomputed weather scenarios, to inform forecasting tools. It’s fast and adaptive, so it can run more scenarios than current models. This means we’ll have more information on future weather events,” said Cyprien.
The model is designed to work on supercomputers, such as NeSI’s Maui supercomputer, which Cyprien used to run larger simulations. However, it is also adapted to smaller-scale simulations on general purpose graphics processing units (GPUs). The model is available to the public on GitHub, however the adaptive, multi-resolution element is still being tested and will be available in the future.
Do you have an example of how NeSI platforms have supported your work? We’re always looking for projects to feature as a case study. Get in touch by emailing support@nesi.org.nz.