The formation of surface archaeological deposits in arid Australia
"NeSI staff developed customised shell scripts that allowed us to generate thousands of simulated populations in rapid succession on the NeSI cluster."
Subject:
The budding yeast Saccharomyces cerevisiae is of significant commercial importance due to its role in the production of bread, wine, beer and other alcoholic beverages, but is also widely used by the scientific community as a model research organism. While we have a vast knowledge of its cell biology, genetics, and increasingly its ecology and evolution, studies of its population patterns are often confounded by geography.
Because of their large population sizes, and ease of transfer, one might expect microbial populations to be well mixed, but there is increasing evidence showing that many are not homogeneous but structured. Understanding the processes that drive population structure and connectivity has implications for understanding the evolutionary trajectories of these organisms.
Since microbes are inherently difficult to observe directly, we rely on genetic methods to infer their movements. This research was conducted by Sarah Knight at the University of Auckland’s School of Biological Sciences, and is part of a larger investigation into the population dynamics of S. cerevisiae in New Zealand. S. cerevisiae were sampled from vineyards and surrounding native bush in major Sauvignon Blanc growing regions and genotyped 850 individual isolates at eight microsatellite loci.
After removing identical genotypes from the same samples due to the clonal nature of growth of S. cerevisiae during the culturing process, the final dataset comprised 369 microsatellite profiles. This dataset was used to infer patterns of population structure and connectivity between these regions and between managed and unmanaged ecosystems within each region (*Knight and Goddard, In Press).
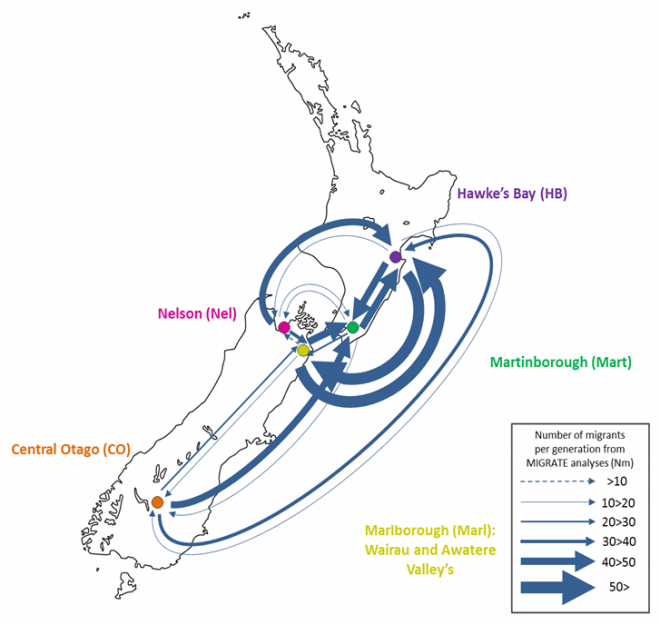
Analyses of genetic data to infer migration rates are typically very computationally expensive. We used a Bayesian coalescent approach implemented in MIGRATE (Beerli, 2006; Beerli, 2009) that ran ten replicate MCMC chains of one million steps in length across all eight loci. With the help of staff at NeSI, optimal settings were determined and we managed to run each chain for each locus in parallel, essentially reducing the time it took to run the analysis by 80 times! Even then the analysis still took weeks to run and without the resources provided by NeSI this analysis would not have been possible.
Our results suggest that migration of S. cerevisiae in New Zealand mimics the movements of fruit by the wine industry, with larger migration rates into the larger wine producing regions. While this work is now largely completed, it would be interesting to examine what differences exist in the population dynamics of microbial eukaryotes that do not have such a close association with human activity. Can we still detect human influenced dispersal? Or are these populations more highly structured?
*This research has recently been accepted for publication by The ISME Journal.
References
Beerli, P. (2006). Comparison of Bayesian and maximum-likelihood inference of population genetic parameters. Bioinformatics 22(3): 341-345.
Beerli, P. (2009). How to use MIGRATE or why are Markov chain Monte Carlo programs difficult to use? Population Genetics for Animal Conservation. G. Bertorelle, M. W. Bruford, H. C. Hauffe, A. Rizzoli and C. Vernesi. New York, USA, Cambridge University Press: 42-79.