
Computing Ocean Flow
On 1 July 2025, the roles, services and technologies of New Zealand eScience Infrastructure (NeSI) were integrated into the crown-owned company, Research and Education Advanced Network New Zealand (REANNZ). Stay connected with us by visiting the REANNZ website.
"Nemoflux allows new users, unfamiliar with the specific model grid, to dive into model data and tackle their real world science questions."
The below case study shares some of the technical details and outcomes of the scientific and HPC-focused programming support provided to a research project through NeSI’s Consultancy Service.
This service supports projects across a range of domains, with an aim to lift researchers’ productivity, efficiency, and skills in research computing. If you are interested to learn more or apply for Consultancy support, visit our Consultancy Service page.
Research background
As part of an international collaboration, NIWA Ocean Modeller Erik Behrens is investigating how climate change affects oceans. Erik is in particular looking into any climate induced changes regarding the Subtropical Front (STF), that is the boundary between cold subantarctic water masses of the Southern Ocean and the subtropical waters to the north. Any displacement of the STF soutward will impact New Zealand fisheries and, more generally, affect the climate of New Zealand by bathing the South Island in warm waters.
Project challenges
Erik Behrens runs the NEMO code, which simulates water temperature, salinity and currents among other ocean quantities. Heat transport from warm, subtropical waters to cold subantarctic waters plays an important role in estimating the location of the SFT and other fronts. This requires the ability to compute water currents to high numerical accuracy.
What was done
Alexander Pletzer developed a Python code (Nemoflux) to help Erik compute water flows across any boundaries.
Nemoflux leverages the MINT library, delivered by NeSI as part of NIWA’s contribution to the UK Met Office Next Generation Model Systems effort.
Main outcomes
Erik can now compute the seasonal variation of currents while taking into account the staggering of the ocean velocity fields. The implemented approach enforces conservation of water to near machine accuracy, regardless of the grid’s resolution. An example is shown below for the Antarctic Circumpolar Current (ACC), we observe that most of the current runs close to the South American continent and that the ACC was weakest during the southern winter and strongest during the spring of 2018.
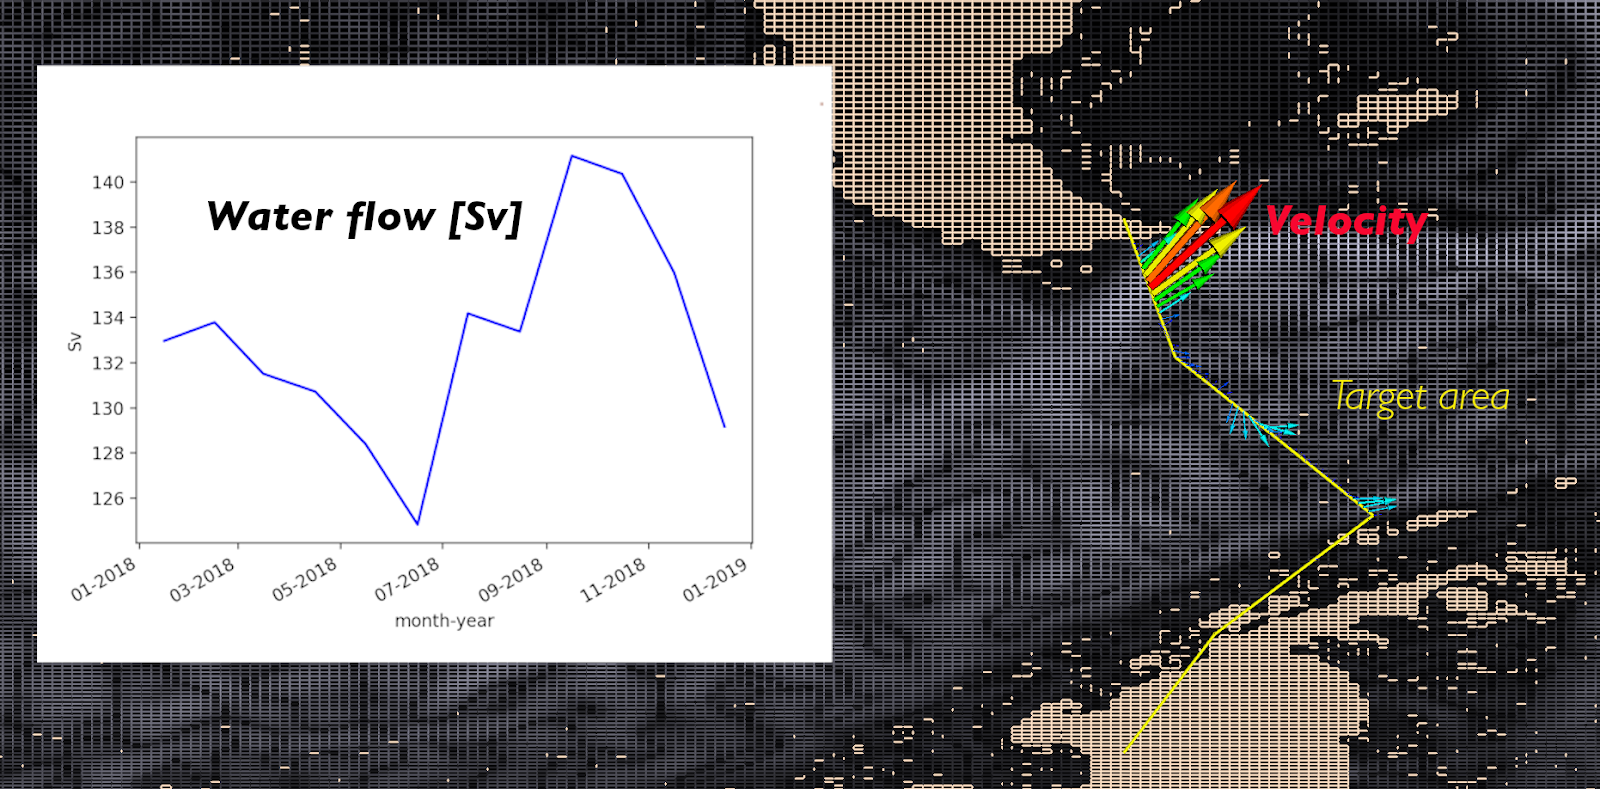
The figure shows the Antarctic Circumpolar Current between South America and Graham Land. The arrows show the direction and intensity of the flow. The flow is computed from the ocean velocity field simulated by the NEMO code.
Researcher feedback
"Working with spatial model data can be challenging. Tailor-made tools are vital to increase productivity and reproducible results and workflows. Nemoflux allows new users, unfamiliar with the specific model grid, to dive into model data and tackle their real world science questions. This tool will enable new researchers and expand the Nemo user group, based on a very convincing consultancy product."
- Erik Behrens, Ocean Modeller, NIWA
Do you have a research project that could benefit from working with NeSI research software engineers or our data engineer? Learn more about what kind of support they can offer and get in touch by emailing support@nesi.org.nz.