The more we know about an area’s topography and landscape, the better plans we can make for land use proposals, transportation strategies, even natural disaster planning. At Landcare Research, scientists are using NeSI supercomputers to help paint a more accurate picture of the Greater Wellington Region.
LiDAR, an acronym for Light Detection and Ranging, is a surveying method that uses the light of a laser to measure the Earth’s surface for building high-resolution 3-dimensional (3D) maps and models.
Using LiDAR, Dr James Shepherd’s team at Landcare Research is hoping to better understand the composition of Wellington’s forest canopies as well as what’s found underneath the canopy, such as vegetation class or group, carbon, biomass, terrain, and impacts from possums.
Recently, the entire Greater Wellington region (8,000 sq. km), including Kapiti Island, was scanned using aerial LiDAR instruments. The scan, which required 1,266 flight lines over the region, collected approximately 82 billion points of 3D data. The dataset was massive and required powerful computing resources to extract the valuable information it contained.
This project needed a great deal of storage space. At least 30 TB, enough data to fill more than 6,000 DVDs, was required to store the LiDAR data and its intermediate files. The processing power requirements were also formidable: processing the LiDAR images on a desktop computer running non-stop would have taken more than 57,000 hours, or six-and-a-half years.
NeSI’s high-performance computing facilities at the University of Auckland made it possible to store all the data and cut the total processing time down to a few days.
“Our supercomputer Pan was an ideal resource for this project,” says Ben Roberts, an Application Support Specialist at NeSI. “By splitting the computational workload over hundreds of cores, we were able to significantly reduce the amount of time needed to produce these data-rich high-quality models.”
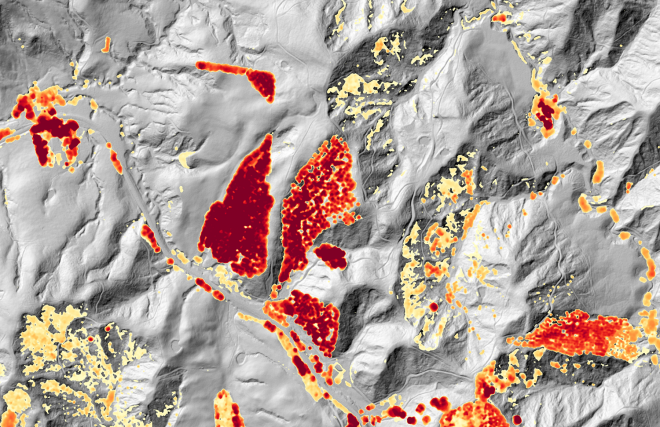
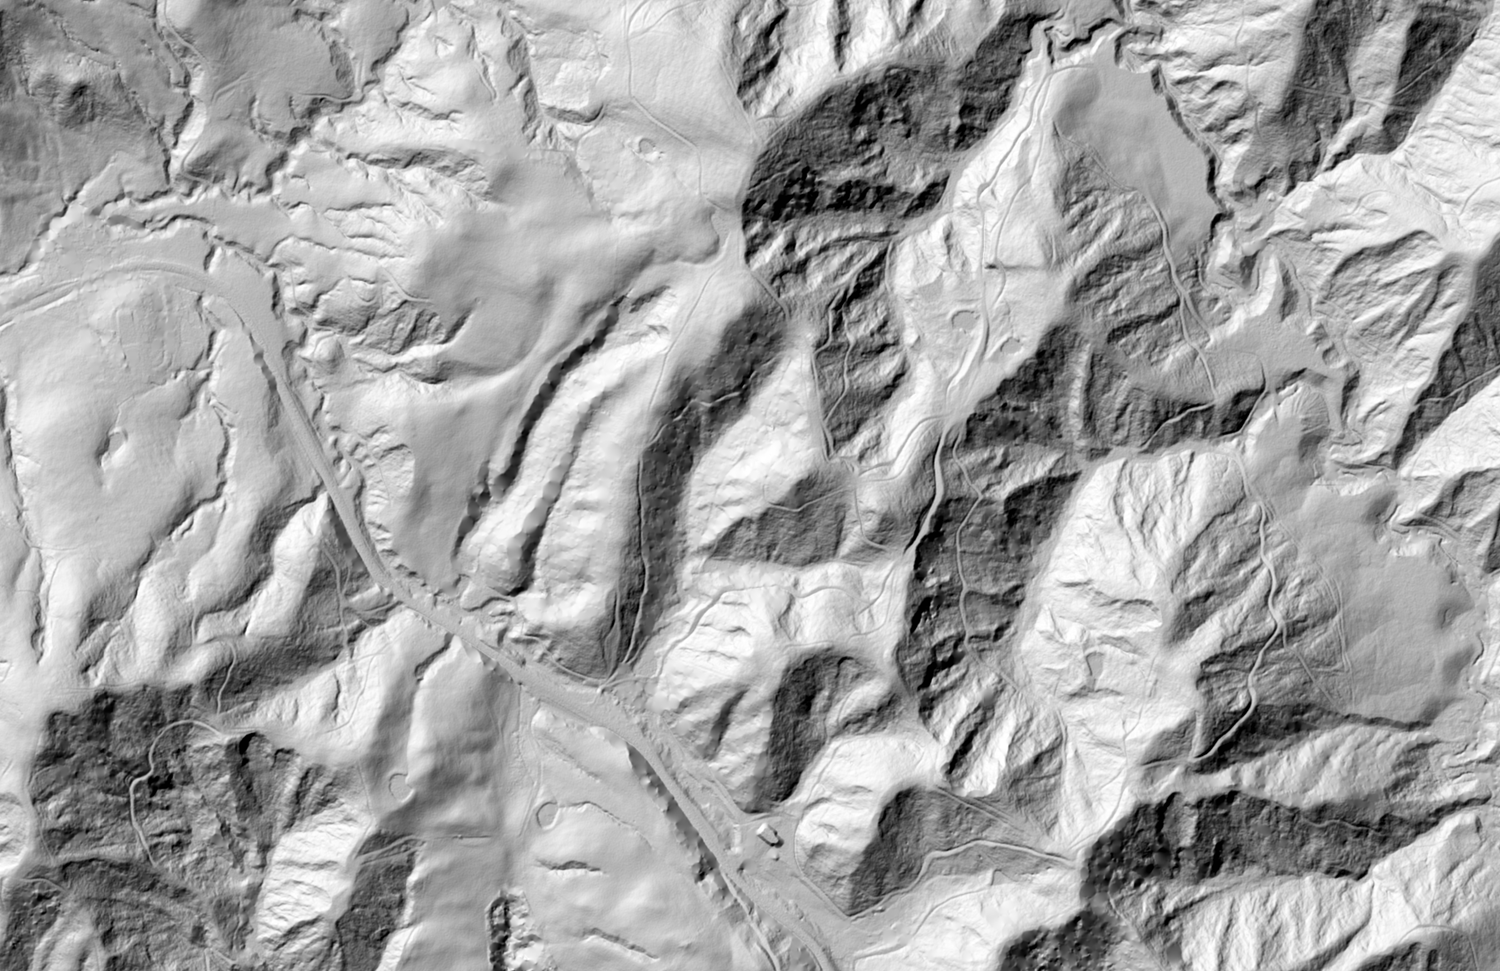
The models themselves are built from point clouds, which are sets of data points that represent the external surface of objects and terrain.
“NeSI’s support is critical to our research into automatic processing and classification of LiDAR point clouds, and the integration of those point clouds into digital terrain models and canopy height models,” says Ben Jolly, Scientific Programmer, Landcare Research. “The data we are collecting has applications in a variety of sectors, including hydrological modelling (e.g. flood modelling), roading, air traffic approaches to the Wellington airport, and more.”
Eventually, the digital terrain and canopy height models produced from the LiDAR data will be made available to the public through Land Information New Zealand (LINZ).