
Speeding up Basilisk with GPGPUs
A NeSI case study by Dr Emily Lane of NIWA.
Subject:
Dr Fraser Morgan, a Senior Geographer at Landcare Research, discusses his comprehensive analysis of environmental pressures on the Ross Sea region in Antarctica.
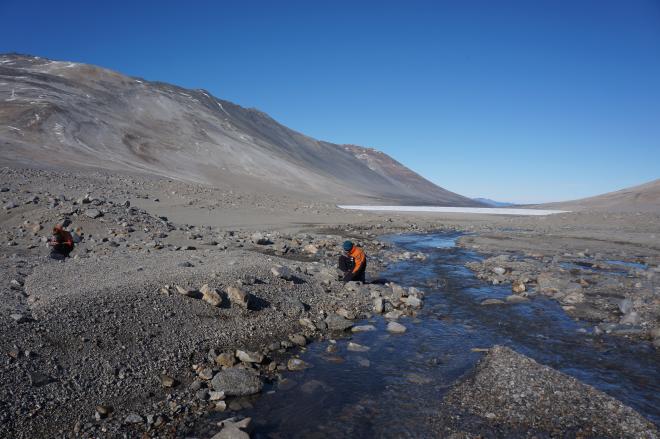
Terrestrial ice-free areas constitute less than 1% of Antarctica, but represent the most biologically active sites. The biology within these areas survives in some of the most extreme environments on the planet and is adapted to the unique climate, geology, soils, and geomorphology found in the ice-free areas of Antarctica. Terrestrial areas are thus a focus for conservation efforts because of this uniqueness but also because they will be the most affected by changing climates.
The Ross Sea region contains more than half of the ice-free ground in Antarctica and so experiences a high impact from scientific and national operations, and tourism. This terrestrial environment faces significant challenges, including pressures from increasing human activity, accelerating climate change, and the introduction of non-native species. To understand and mitigate these pressures, the Scientific Committee on Antarctic Research (SCAR) highlights an urgent need to “provide an integrated, comprehensive and dynamic approach to the conservation of Antarctica.”
To achieve this we have looked to data science to unlock and explain these pressures. The explosion of data over the last 15 years has had a massive impact on science. Disciplines have moved from data-poor to data-rich and Antarctic terrestrial science is no exception. Utilising the inherent value of Antarctic data is imperative because of the unique nature and importance of the region, and also because collecting data in Antarctica is difficult and expensive. Using this data, we are undertaking a variety of analyses to highlight the range of environmental pressures on the ice-free areas of Ross Sea region.
Some of these analyses rely entirely on the resources provided by NeSI. In particular NeSI enables: data transfer and use between members of the project team; undertaking continental scale climate analysis at a 1km spatial resolution on a daily basis over the last 16 years; modelling the regional scale effects of climate change; and modelling thousands of individuals in their likely activity patterns while on the ice-free parts of Antarctica using Agent-based modelling.
Access to NeSI has improved the quality of our analyses and has enabled us to highlight the range of environmental pressures that this part of Antarctica faces. Our MBIE-Funded four-year research programme has key policy outputs and we work alongside the New Zealand Government to ensure these are adopted and used at the Antarctic Treaty meetings to improve environmental management of the continent.
The programme's science goals are: to improve the understanding of how the terrestrial Antarctic environment may respond to climate change and other human impacts; and to facilitate the ongoing improvement of policy development and management of human impacts in Antarctica.
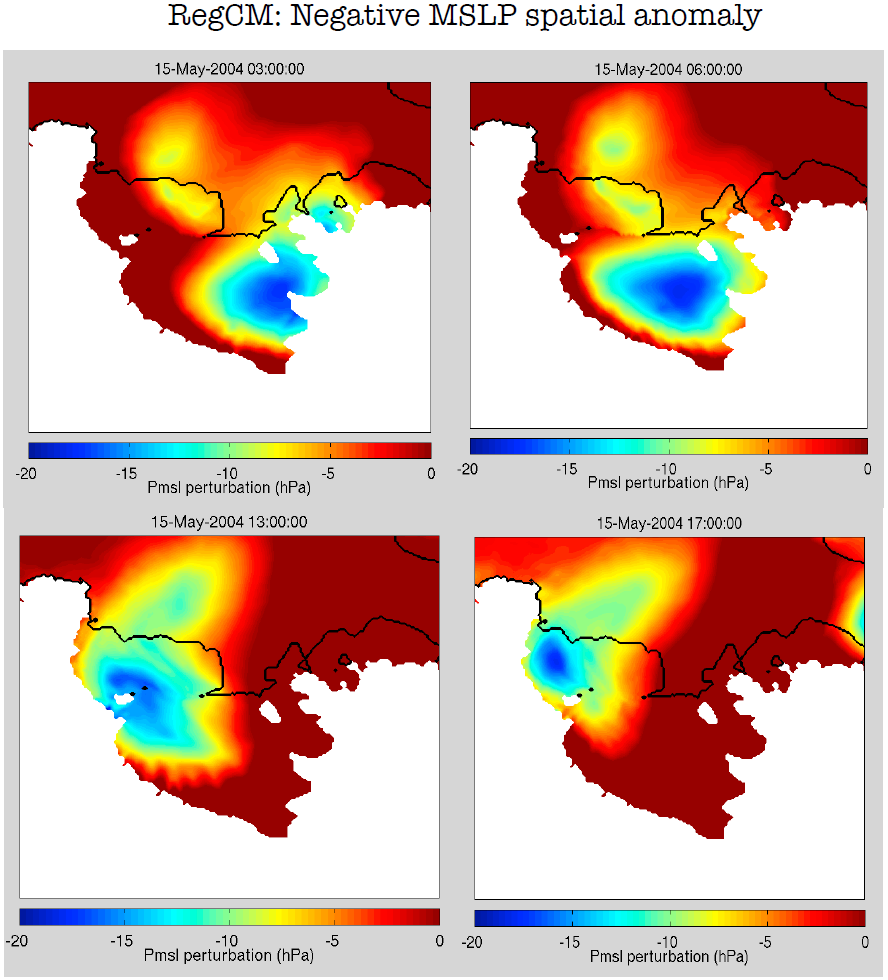
Using the Regional Climate Model version 4.4.5 (RegCM), the programme is analysing and predicting the historic, current, and future climate for the Ross Sea region (RSR) of Antarctica. We do this through the temporal and spatial dynamical downscaling of atmospheric state variables (such as wind velocity and temperature) and surface parameters (such as land surface temperature and precipitation) to the Ross Sea region scale. The approach is using existing climate station data and output from coupled global atmospheric-oceanic circulation models (GCM) as input.
This method will resolve regional climate dynamics at a 10 km spatial resolution, a significant improvement over the 100–300 km resolutions from GCMs. To tune the model for the RSR, we will compare surface-based (climate station data) and satellite-derived climate observations (land surface temperature). The use of the satellite-derived climate observations is a novel approach to tune these models and a necessary one in the RSR because of the paucity of climate stations. The RegCM model for the Ross Sea region can also be initialised by GCM output of future climate change effects under various levels of greenhouse gas emission scenarios such as the Intergovernmental Panel on Climate Change (IPCC) scenarios. This will enable the forecasting of the effects of these scenarios on climate in the RSR. Computationally this is the most intensive utilisation of NeSI, with RegCM being run on FitzRoy.
Using data products from the Moderate Resolution Imaging Spectroradiometer (MODIS) on NASA’s Terra and Aqua satellites, we have developed a processing pipeline to build a land surface temperature data cube at a 1km spatial resolution over the entire Antarctic continent. The data cube has a daily record for every 1km cell in Antarctica over the last 14 years. Processing, harmonising, storing and analysing this data are only possible through the use of NeSI. The data has also been validated through a comparison with the ground based stations (Meyer et al 2016). Once complete we are able to analyse the data cube for a variety of patterns and trends usually hidden when observing on short time periods, such as the way in which the seasons are changing over the last 14 years (see figure below). These types of analyses have assisted in the understanding of environmental changes which contain biological activity through additional analyses focusing on changes in bioregions.
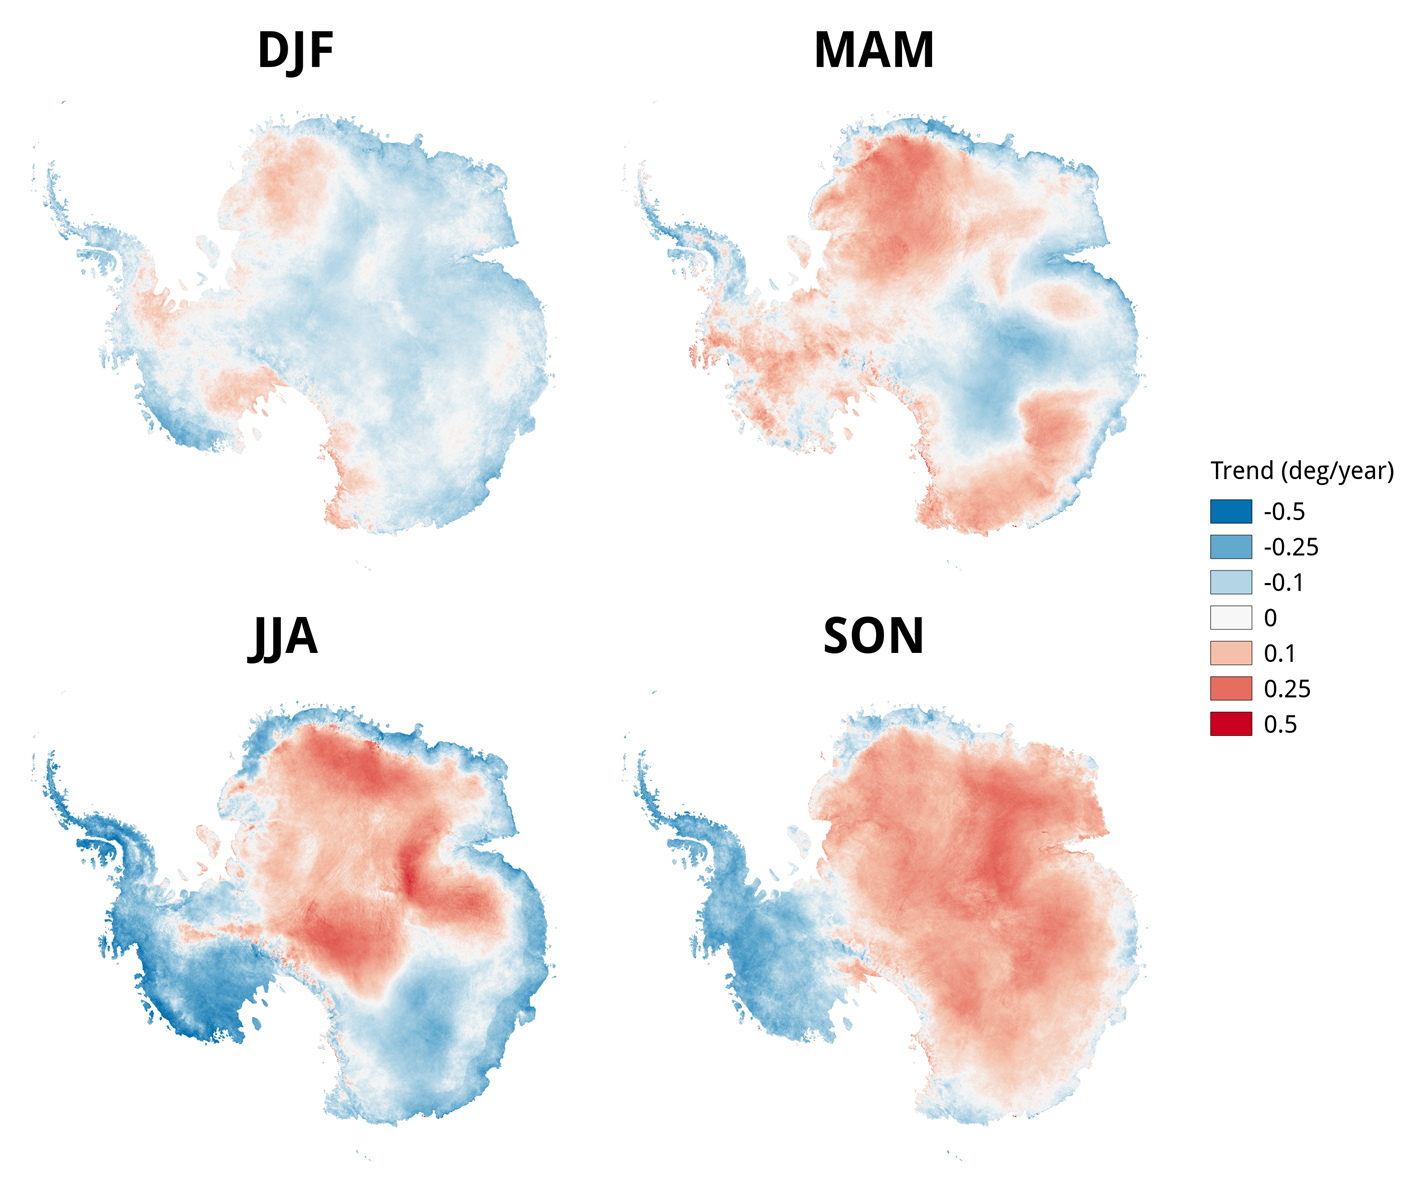
The redder areas in Figure 2 constitute a warming trend while the bluer constitutes a cooling trend. Summer = DJF (December, January, February), Autumn = MAM (March, April, May), Winter = JJA (June, July, August), and Spring = SON (September, October, November).
REFERENCE: Meyer, H.; Katurji, M.; Appelhans, T.; Müller, M.U.; Nauss, T.; Roudier, P.; Zawar-Reza, P. Mapping Daily Air Temperature for Antarctica Based on MODIS LST. Remote Sensing. 2016, 8, 732.