Overcoming data processing overload in scientific web mapping software
"To create the map caches for one of our tools would take about a month of continuous processing."
Subject:
The Challenge:
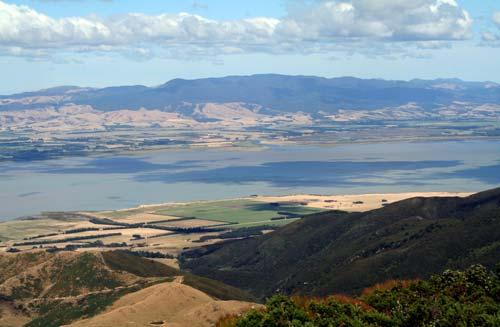
New Zealand’s Wairarapa region includes 8450m2 of variable terrain that needed to be mapped for land users and scientists. Processing data over this huge area stretched Manaaki Whenua - Landcare Research’s local resources.The Solution:
Using NeSI's Mahuika cluster and engaging technical help from Ben Roberts enabled Manaaki Whenua researchers to create a largely automated workflow for processing map tiles.The Outcome:
Highly detailed updates were applied to Manaaki Whenua’s S-map Online tool and other geographical models. An ongoing relationship has been forged between the Manaaki Whenua team and NeSI to process future tiles.
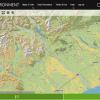
Manaaki Whenua – Landcare Research has developed the mapping tool, S-map Online, to show detailed information about New Zealand’s soil types and terrain. James Barringer, Robbie Price, and Pascal Omondiagbe were part of this project, identifying terrain boundaries of the Wairarapa region.
The team looked to include terrain data into several models, as well as the S-map Online tool. Terrain describes the physical shape of the land, from the elevation of steep hills, to water bodies, and rolling downs and flat terrain. Terrain information is used to guide ecology and land use, as well as show scientists how New Zealand’s land is changing over time.
Originally, the team were processing the terrain data on Manaaki Whenua desktop resources, using the mapping platform ArcGIS. However, with some map tiles showing detail up to one square metre, over the 8450m2 Wairarapa area, the processing time for map tiles was beginning to take weeks. Instead, the team looked to use NeSI’s Mahuika cluster to process map tiles in parallel.
“We have a number of databases we work on, like S-map and digital elevation models. They’re quite demanding on desktop. As we started to process large areas in detail, that’s when we began running into trouble,” James said.
Local desktops were no longer capable of supporting the data processing the team needed, so the team contacted NeSI. In order to move their data onto the Mahuika cluster, the team first needed to translate their workflow from ArcGis software to an open-source tool to be read by the cluster. While this step required little manual intervention, they quickly ran into another problem.
“We had a workflow but we realised it was running sequentially, not in parallel. That’s when we went back to NeSI and brought in Ben Roberts to have a look. Ben helped us modify the workflow,” Pascal said.
Without being able to process multiple tiles at once the advantage of using the Mahuika cluster wasn’t being used. With Ben’s help, the team were then able to run 499 tiles in parallel. Due to the large data requirements to process each tile, multiple Mahuika cores were required to handle each one.
“Another problem we had was we couldn’t monitor when a job was done. This meant we had to go back and manually check,” James said.
The team wanted to automate as much of their workflow as possible. Their desktop processing had been semi-automated but it also required regular manual intervention. This time-consuming process was something the team wanted to fix when moving to Mahuika.
“In the past, because these jobs weren’t run frequently, there wasn’t a lot of need upfront to optimise the workflow. When we moved to the cluster, we decided to run tiles locally while they were being processed by Mahuika. This meant we could test for issues and modify things locally, then apply them to the cluster to get a better result,” Robbie said.
By editing the workflow as the data was being processed, and using Ben for help translating the workflow to the cluster, the team were able to increase automation. Now the team store their data on a local computer and a custom-designed iR library is used to send the data and processing instructions to the Mahuika cluster for processing.
“Now I’ll provide a classified TIF file to Pascal or Robbie. They’ll fire it off to Mahuika and we’ll have a result back the next morning. In the past, this could have taken us a week or more. It’s become really built into our process,” James said.
The team are now moving on to the more complex elevation of the Wairarapa. This includes difficult terrain where mapping the changes in land height become more complex and data-heavy.
“The challenge is you may not have a nice homogenous area. If you think of a slope map made from an elevation model, it’s highly variable. You’re trying to do some processing to find dominant slopes and draw a boundary around them,” James said.
This work continues to leverage NeSI resources to process tiles, making Mahuika and the NeSI Support team members vital contributors to the ongoing success and evolution of the Manaaki Whenua team’s models.
Do you have an example of how NeSI support or platforms have supported your work? We’re always looking for projects to feature as a case study. Get in touch by emailing support@nesi.org.nz.