Exploring potential for new energy resources
"I am grateful to the NeSI team for assisting with the compilation of the TOUGH+HYDRATE code for this research."
Subject:
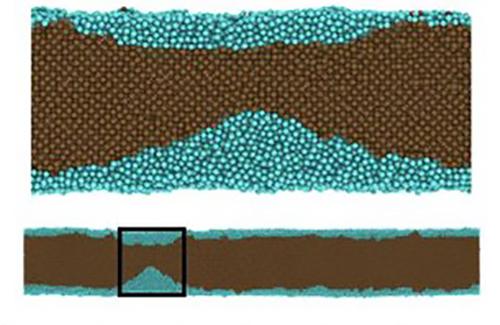
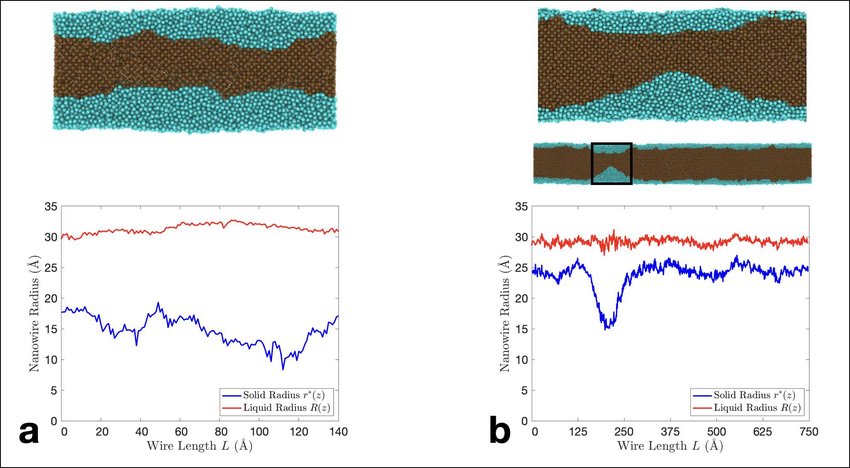
At the University of Auckland, Dr Kannan Ridings is using computer simulation to investigate nanowire stability at elevated temperatures. The idea is that nanowires can melt via different pathways depending on their length. Conventional wisdom states that nanowires should melt at their surface, with the liquid moving from the outside inwards to the wire centre. For nanowires whose lengths are large compared to their radii, they can melt via the growth of an instability which causes the solid to break apart.
To investigate this requires hundreds of simulations of nanowires of different radii and lengths, gathering statistics on how the crystal structure of nanowires for a given radii and length, behaves at high temperatures. Once the simulations are complete, the data generated must be processed efficiently. MATLAB scripts are used to identify the solid-liquid interface of each nanowire close to the melting point. Analysing the data from each nanowire simulation must be done multiple times for each simulation, causing the time taken on a conventional computer to process all this data to increase exponentially.
Kannan is scaling up his research to consider multiple nanowire radii where previously they have just looked at one. This means there is a significant increase in the number of simulations to run, which in turn creates more post-processing work. Although some of the post-processing steps have been automated previously, with the increased number of simulations the remaining manual post-processing steps were creating a bottleneck and reducing productivity.
Another challenge is that the main simulation runs on the Māui supercomputer, which is designed for running large parallel jobs, while the post-processing is mostly serial and requires Matlab, which is not supported on Māui. In the past this has meant Kannan had to download intermediate results and process them on his local machine, costing more time.
NeSI Research Software Engineer Chris Scott worked with Kannan to help automate the final post-processing step, which involved running a Matlab script in each simulations directory. In order to enable the Matlab script to run without manual input, we had to infer certain parameters based on the directory name of the simulation, which was named in a structured manner.
The Matlab part of the post-processing was set up to run on the Māui ancillary nodes via Slurm. The Māui ancillary nodes are designed for running serial pre and post-processing jobs associated with parallel simulations running on the main Māui cluster. Fortunately, one can submit Slurm jobs to the Māui ancillary nodes directly from the Māui cluster, which means the simulations and post processing can both be managed from the same place.
Automation of the post-processing steps, enabling scaling up to larger numbers of simulations to improve scientific outcomes
All the post processing happens on NeSI - no need to spend time copying intermediate results back to the local machine and processing them there
"The help I received from Dr Chris Scott, as always, really helped save a lot of time. Providing Chris with some initial scripts that I had already written really made the process super easy, and we were able to achieve the desired results quickly. This has helped me to scale up my research capabilities not only with this work, but also with future endeavours too."
- Dr Kannan Ridings, Department of Physics, University of Auckland
Do you have a research project that could benefit from working with NeSI Research Software Engineers or our Data Science Engineer? Learn more about what kind of support they can offer and get in touch by emailing support@nesi.org.nz.