We allow students, academics, alumni and researchers to get secure and seamless access to our computer resources using one set of credentials granted by their home organisation.
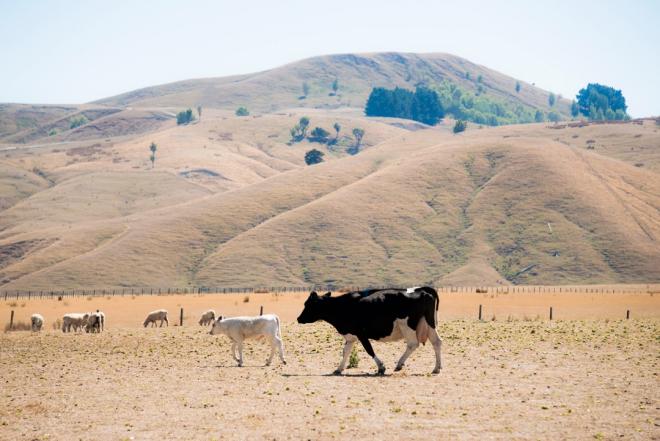
Stock struggling in hot, dry weather - Wairarapa. The new NIWA and MPI drought forecasting dashboard helps farmers and growers with predictions of rainfall, dryness, and potential drought across New Zealand. [Photo Dave Allen, NIWA]
New tool revolutionising drought forecasts
On 1 July 2025, the roles, services and technologies of New Zealand eScience Infrastructure (NeSI) were integrated into the crown-owned company, Research and Education Advanced Network New Zealand (REANNZ). Stay connected with us by visiting the REANNZ website.
“This tool enables us to give more frequent and district-level predictions of rainfall, dryness, and drought. Providing advanced warning of future dry spells will be invaluable.”
This case study was originally published on the NIWA website. We're re-posting here as researchers involved in the project made use of A100 GPU computing resources on the NeSI HPC Platform. If you'd like to learn more about what's available through NeSI, visit our HPC and data analytics section or contact NeSI Support.
A newly launched tool developed by NIWA and the Ministry for Primary Industries (MPI) to predict dryness and drought will help farmers and growers be better prepared for challenging weather conditions.
Using the latest in artificial intelligence and long-range weather modelling, the free tool provides week-to-week predictions of rainfall, dryness, and potential drought 35 days into the future.
The outlook updates daily, capturing the latest changes in the climate system. It also offers long-term forecasts at a much higher spatial resolution than previously available.
The launch of the tool comes after official confirmation that the El Niño weather pattern has developed in the Pacific. El Niño events typically come with an increased risk for abnormally dry conditions across many regions of New Zealand, particularly in the north and east.
NIWA meteorologist, Ben Noll, said the new tool is already making a big difference.
“This tool enables us to give more frequent and district-level predictions of rainfall, dryness, and drought. Providing advanced warning of future dry spells will be invaluable,” said Noll.
MPI’s director of Rural Communities and Farming Support, Nick Story, said the new software programme will be invaluable.
“The tool has been tailored for the primary sector and we’ve collaborated with farmers and growers over the last three years to ensure it provides useable information. Farmers and growers can utilise this tool to prepare in advance for drier than normal weather and the impacts this might have on production, pasture growth, and animal welfare,” said Story.
Maniototo farmer and Irrigation NZ director, Emma Crutchley, said that any forecast, short or long-term, is good.
“What we find is if we can get a more accurate medium-term forecast, then that enables us to respond rather than working off a short-term forecast where you’re making reactive decisions all the time. Having as much information as we can around an uncontrollable thing, which is the weather, is really helpful to resilience in the farming business,” said Crutchley.
The drought forecasting tool is underpinned by the NIWA35 platform, combining a 35-day, global forecast model from the National Oceanic and Atmospheric Administration (USA) with data-driven techniques to improve the model’s predictive capacity on a local level across Aotearoa New Zealand.
The tool is a companion to the NZ Drought Index (NZDI), an observational tool launched with MPI in 2017 that measures the current state of dryness and drought. Its users include much of the primary sector, as well as government and industry bodies.
Ben Noll said a lot of work has gone into making sure that the data is available in a way that works for those who need the tool.
“With climate change, the leading cause of increase in drought risk is the temperature-driven increase in atmospheric water demand. This leads to drier soil conditions, water stress for vegetation, and low hydrological flows. Having this new tool on our belt will hopefully help the country be more prepared for and resilient to potential droughts, both now and in the future,” said Ben.
Attribution:
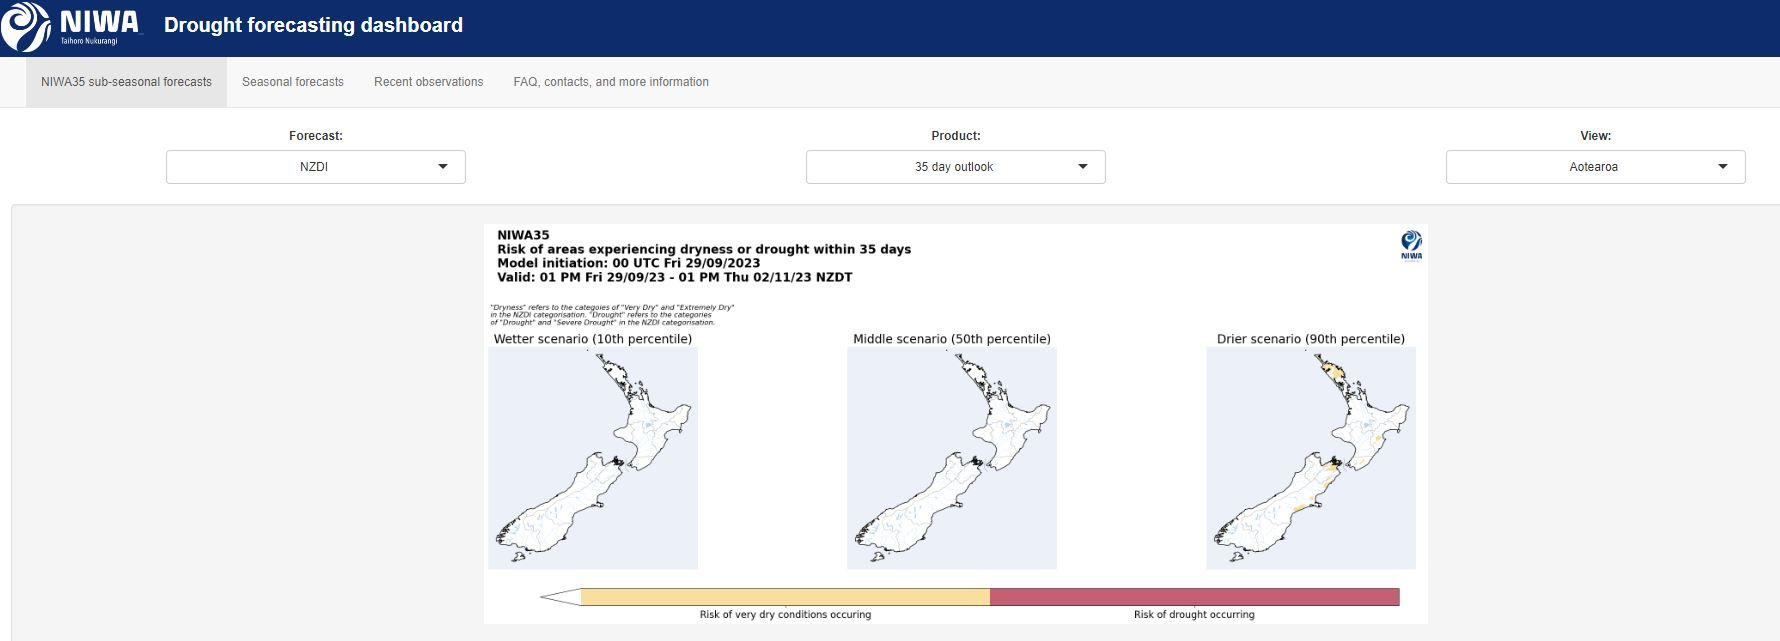
Pictured above is a dashboard view of the drought forecasting tool.
Do you have an example of how NeSI platforms or support advanced your research? We’re always looking for projects to feature as a case study. Get in touch by emailing support@nesi.org.nz.
"We are very grateful to the NeSI team for helping us to automatically build our coupled model in a container, allowing us to be resilient and circumvent any platform changes/updates."