As organisms seek out new areas to colonise, they encounter others who they need to compete with. Within an ecosystem, the presence of certain species may make it harder for some species who arrive later and easier for others. Gathering quantitative data to gain insights into this process has previously been very technically difficult.
A team comprising Louis Ranjard, David Welch, Marie Paturel & Stéphane Guindon from the University of Auckland's Department of Statistics have been able to use Bayesian statistics to shed light on the process. Louis explains the work:
What is the background to your research?
Competition between organisms influences the processes governing the colonisation of new habitats. As a consequence, species or populations arriving first at a suitable location may prevent secondary colonization. While adaptation to environmental variables such as temperature and altitude is essential, the presence or absence of certain species at a particular location often depends on whether or not competing species co-occur. Despite the potential of competition to maintain populations in isolation, past quantitative analyses of evolution have largely ignored that factor because of technical difficulties.
We have developed a model that integrates competition along with dispersal into a Bayesian phylogeographic framework. The proposed model takes genetic sequences and their spatial coordinates as input in order to date dispersal events and estimate dispersal and competition parameters.
How do you simulate an area's ecological colonisation?
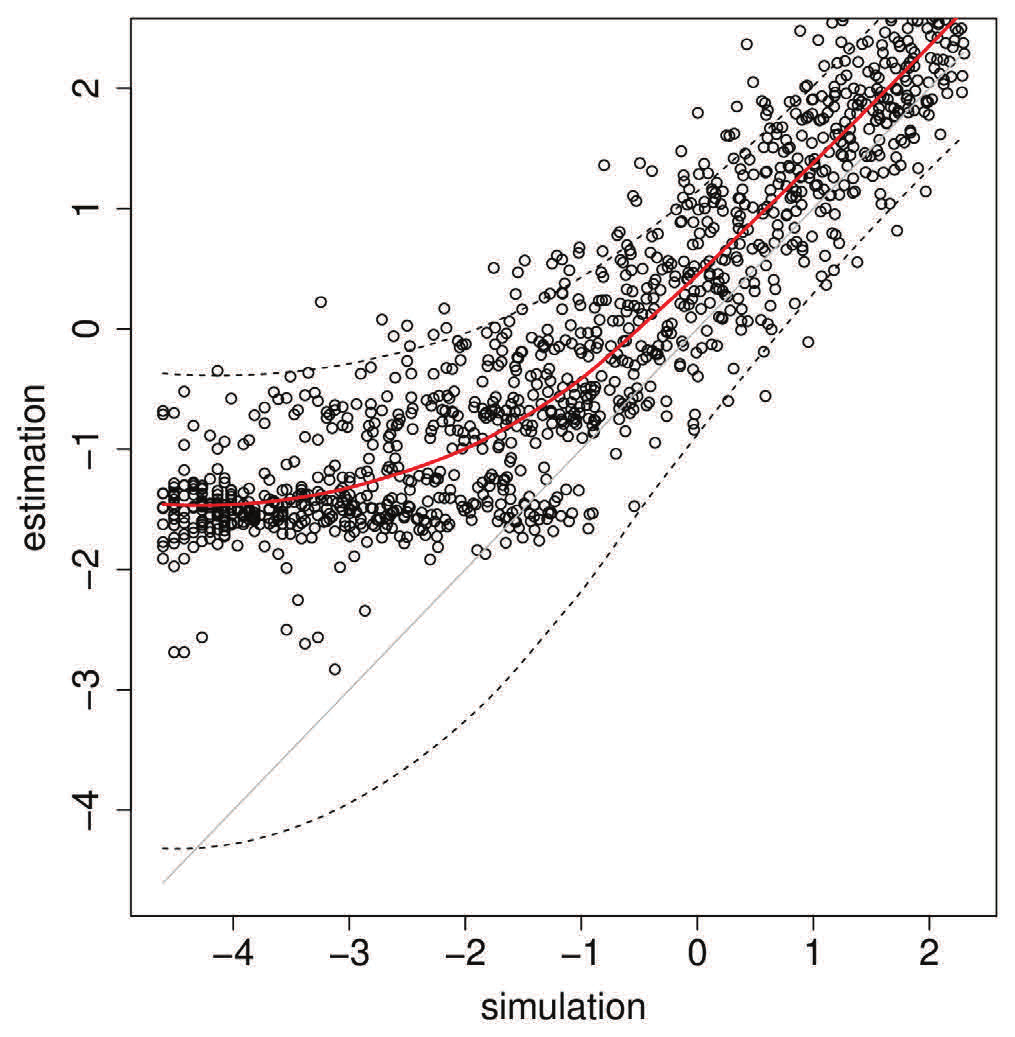 Figure 1 - Results from simulations shows that our approach can successfully detect the influence of competition on the history of colonisation of space inferred from molecular sequences. Each dot on the graph corresponds to a different simulation instance. Image courtesy of Louis Ranjard.
Our statistical modelling on Pan uses the R software and high throughput is obtained by using parallel processing. In the first step to get an accurate understanding of how our approach performs, an extensive test on the NeSI Pan cluster was done by (i) performing simulations of organisms colonising space and competing while evolving and (ii) estimating the competitive and dispersal parameters from the genetic diversity generated by these simulations.
Results from simulations shows that our approach can successfully detect the influence of competition on the history of colonisation of space inferred from molecular sequences. Each dot in the image below corresponds to a result from a different simulation instance.
In the second step, Pan was used to analyse a dataset of Hawai’ian endemic species of the Banza genus called Hawai’ian katydids – grasshopper-like insects. The genetic relationships among these organisms show evidence for island radiation with different species inhabiting the Hawai’ian archipelago.
The phylogenetic tree built from mitochondrial sequences exhibits a striking “progression rule” pattern whereby each island appears to have been colonised only once. No obvious environmental feature varying across islands explains the observed geographical distribution of these organisms. Therefore, adaptation does not seem to be the factor causing the absence of secondary colonisation.
We fitted our model to a rooted phylogenetic tree with node heights expressed in calendar time units. Using Pan we could demonstrate that competition can be detected with high sensitivity and specificity from the analysis of genetic variations in space.
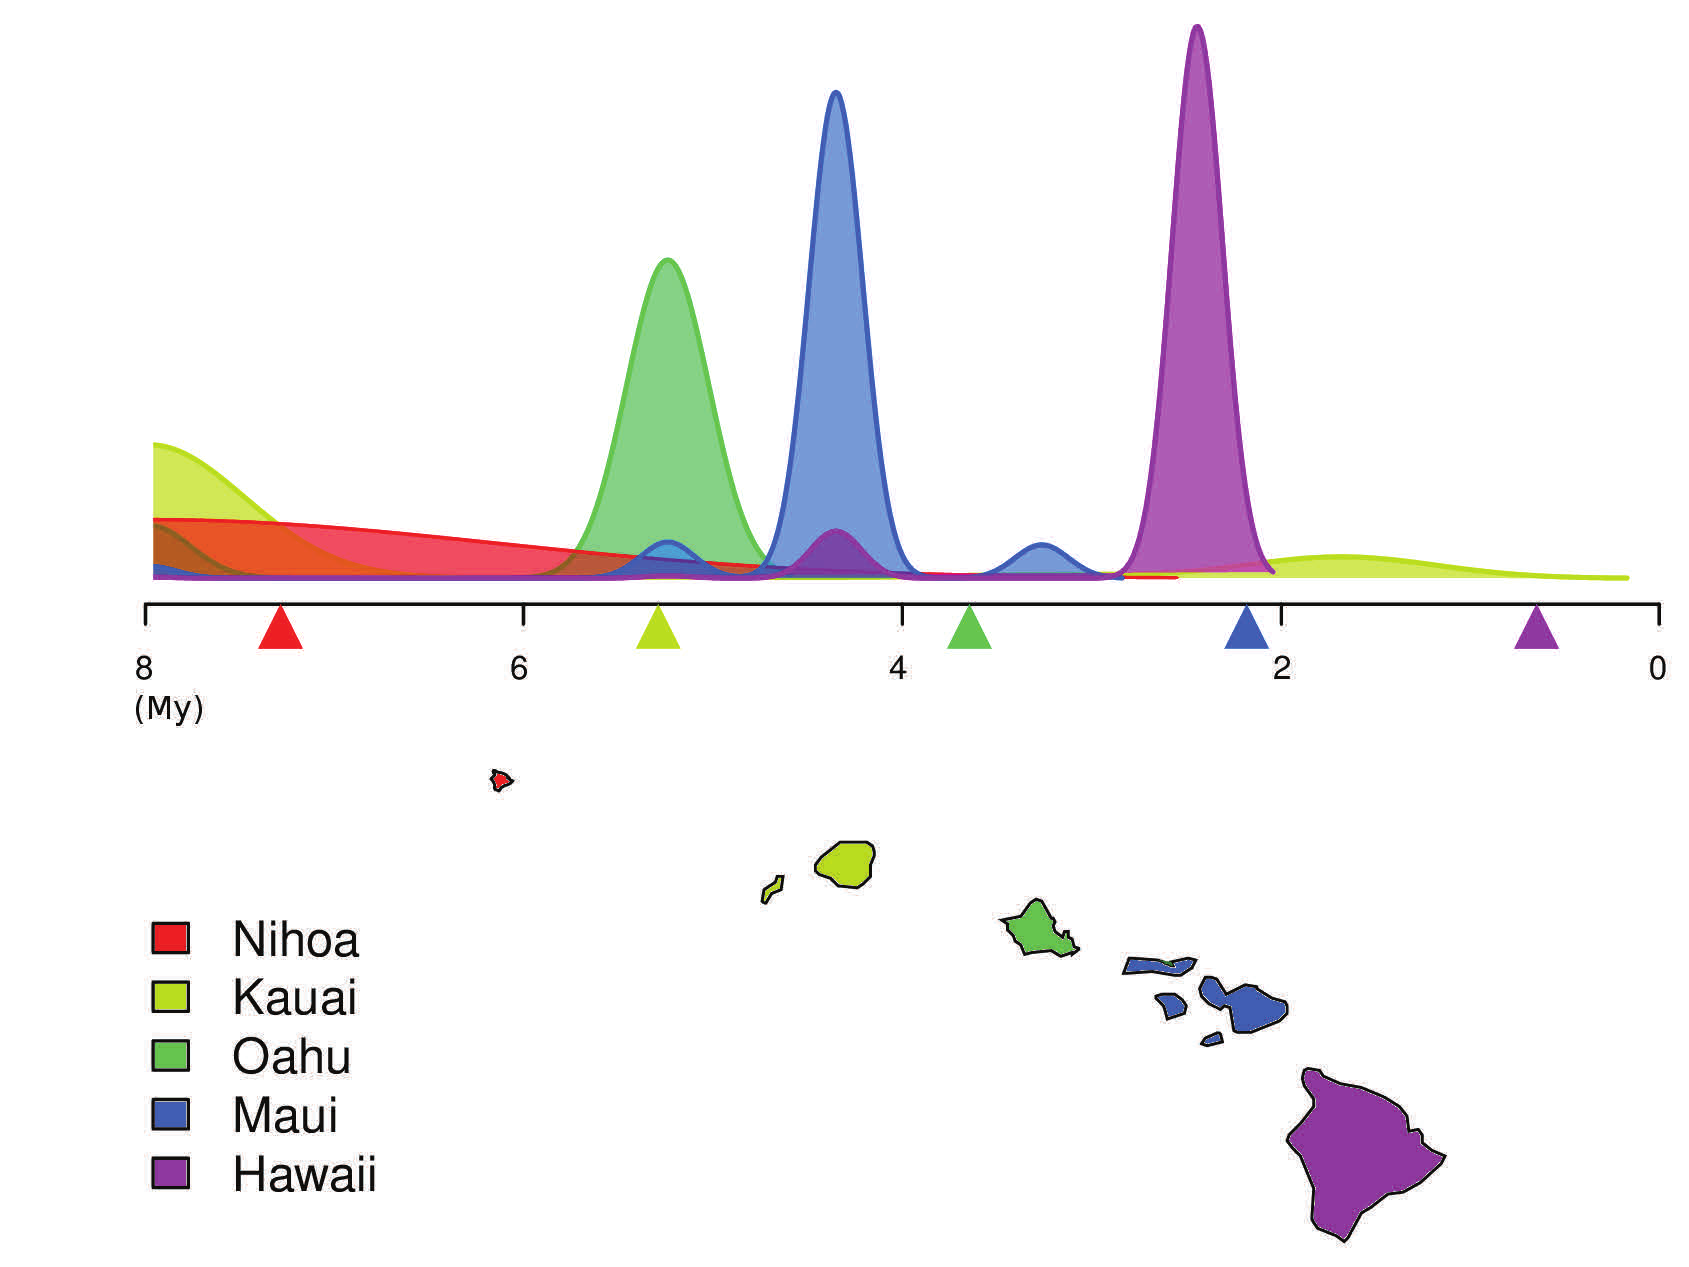 Figure 2 - Colonisation date estimates of each Hawaiian Island from molecular sequences for the Hawaiian katydids (in million years, My). Geological estimates of islands formation are indicated by coloured triangles under the time axis. While the order of colonisation and geological formation agree, the time shift between the two dating approaches can probably be explained by an underestimate of the genetic mutation rate in these organisms.
Colonisation date estimates of each Hawaiian Island from molecular sequences for the Hawaiian katydids (in million years, My). Geological estimates of islands formation are indicated by coloured triangles under the time axis. While the order of colonisation and geological formation agree, the time shift between the two dating approaches can probably be explained by an underestimate of the genetic mutation rate in these organisms.
What is next?
In the next step, we are planning on extending our model to integrate extra environmental parameters that may have affected the colonisation of space. The NeSI Pan cluster will be used similarly to investigate the characteristics of the new model and how it can be applied to any biogeographical datasets for which genetic data is available.
Acknowledgement
This case study has been adapted from the original produced by the Centre for eResearch at the University of Auckland.