Simulating quantum mechanics
Emerging technological advances in laboratory methods have made it possible for scientists to directly observe the fragile quantum state.
Subject:
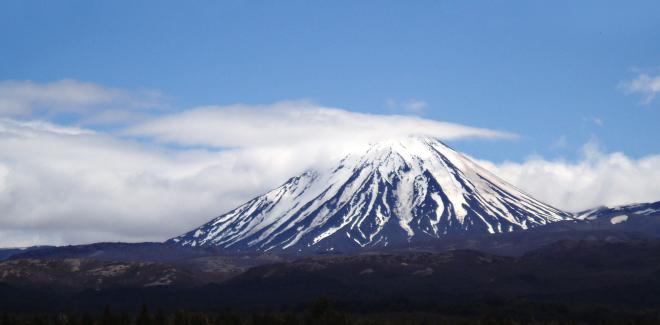
On 6 August 2012, Te Maari erupted. Te Maari is part of a geologically active area that includes Mount Tongariro and Mount Ngauruhoe on New Zealand’s North Island. The eruption provided an excellent opportunity to test and validate methods for modelling the dispersion of ash and gas.
This validation strengthens New Zealand's ability or respond to future volcanic hazards. The study also revealed further improvements that could be included in the model.
The eruption produced a relatively small ash-dominated plume that covered 1,600km2 in about an hour. The plume’s volume reached ~230,000m3 with a height of 8-10km. The human impact was relatively minor, but the eruption was noticed over a widespread area with gas emissions recorded for several months afterwards.
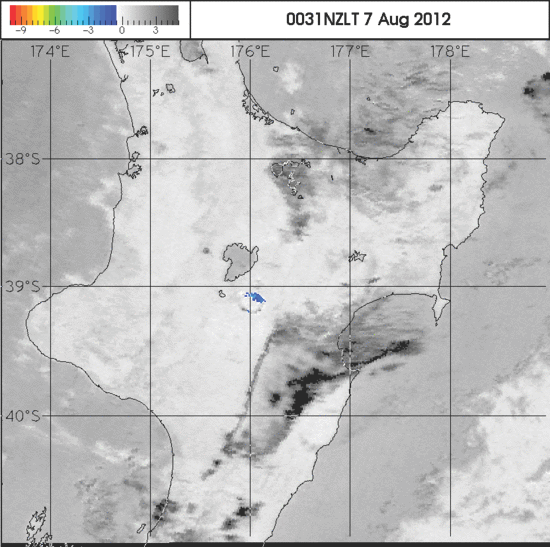 12:31 am (NOAA 19)
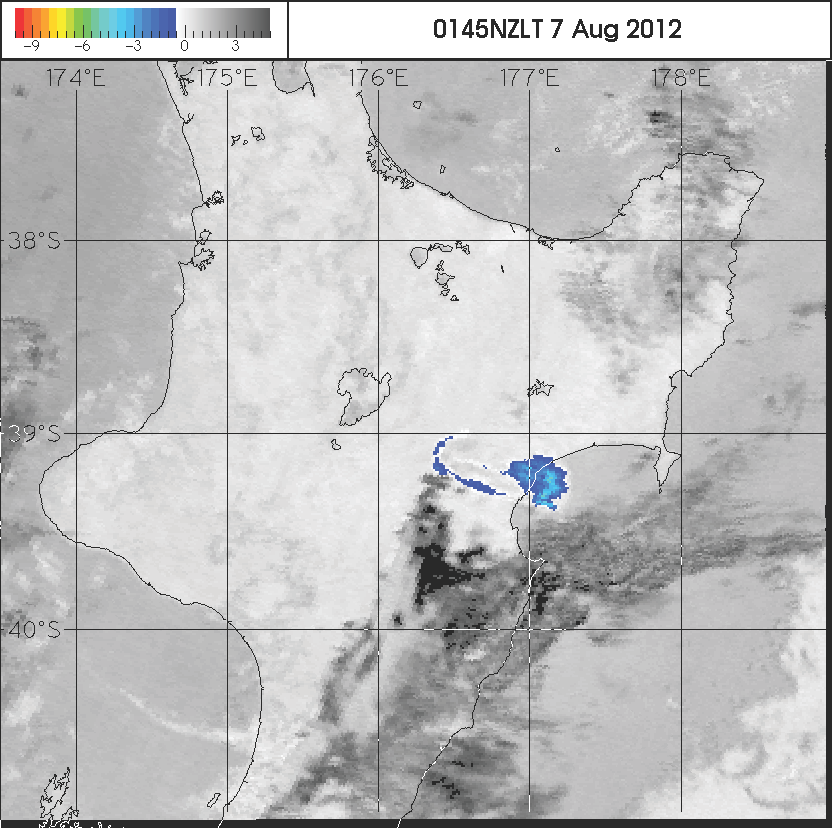 1:45 am (NOAA 19)
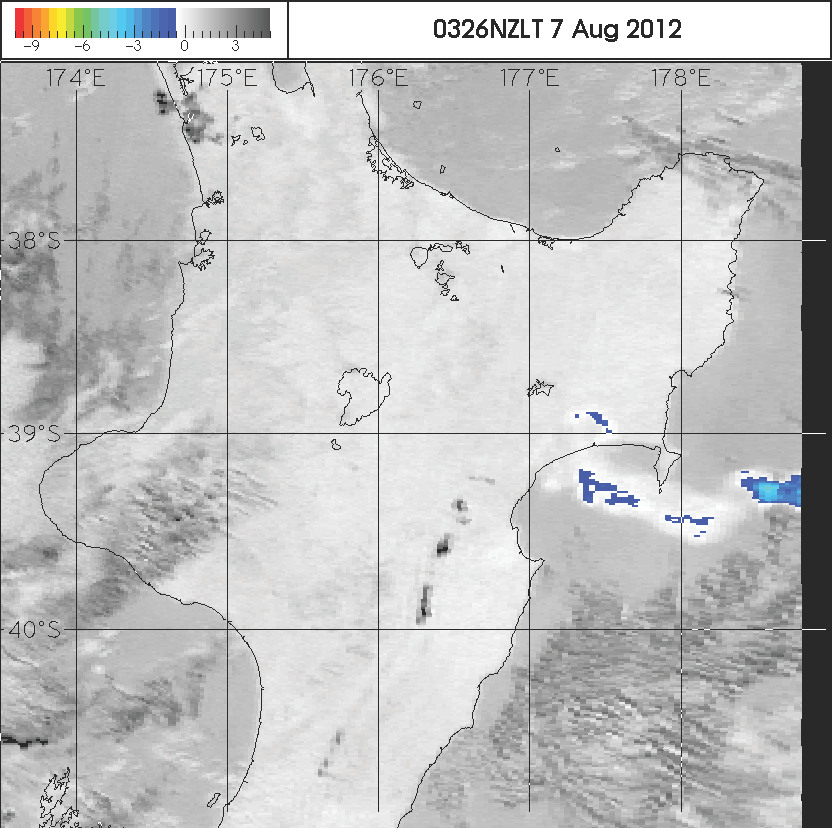 3:26 am (NOAA 18)
Simulated ash fall cross-section
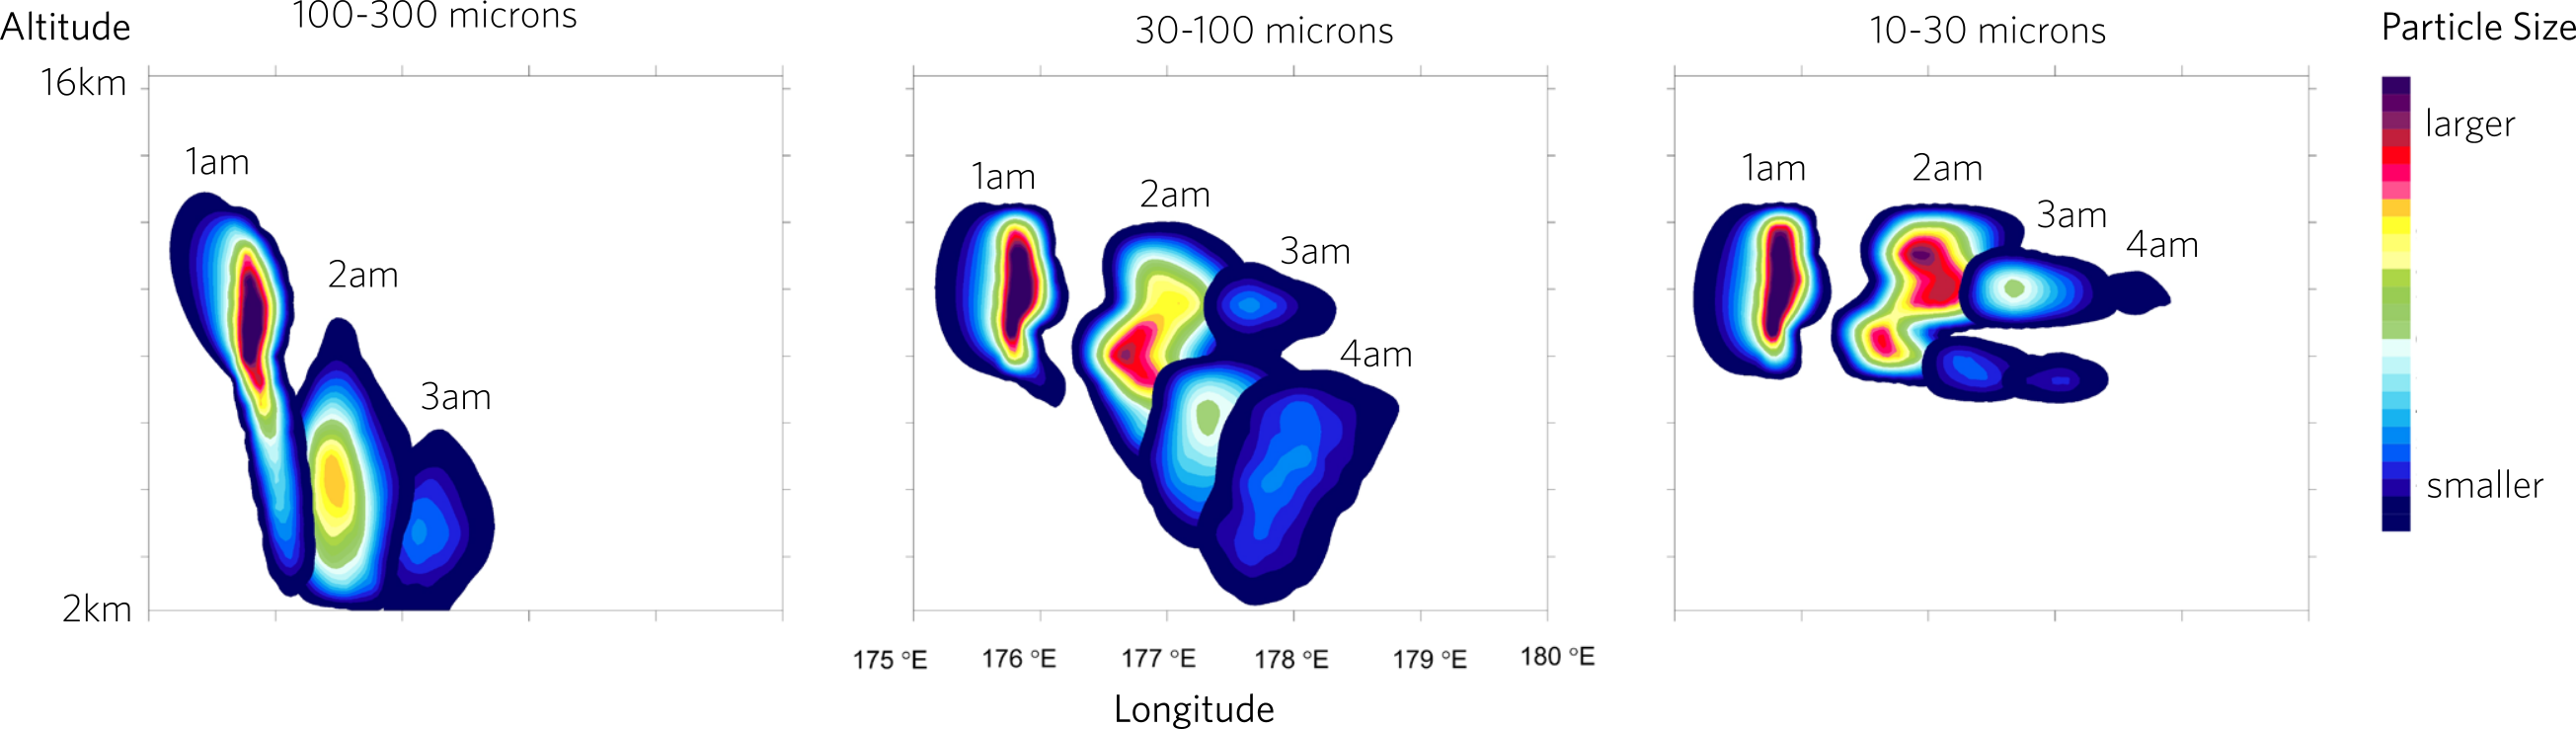
To detect the upper level (troposphere) ash movement, satellite imagery provided by NOAA was processed using computer vision algorithms on NeSI infrastructure. Some of the imagery processed can be seen above. Information about ash volume and density as was supplemented with other sources to generate a comprehensive picture of how the ash travelled through the atmosphere. These sources included samples of ash at various locations and weather data produced by the NWP model NZLAM-12.
Observational and NWP data then enabled realistic inputs to be provided to the dispersion model, NAME. NAME is produced by the United Kingdom's Met Office. It is an air pollution model, originally developed in response to the 1986 Chernobyl accident. A few of NAME's outputs can be seen in the second set of figures above.
The modelling agreed quite well with observations. For example, a split of the plume at the 10-30 micron level occurred between 2-3am. In the satelitte imagery, particles of 11 and 12 microns in diameter are split into a main cluster and a smaller fringe cluster by 3:45.
While upper level ash movement was very consistent between, there was more ash fall at large distances (100-150km) from the mountain than forecast by the model. This suggests that more features need to be incorporated into the model. Candidates for inclusion are particulate aggregation and ice nucleation effects.
Events such as the Te Maari eruption enable the science response to emergencies to be rigorously tested. In order to provide timely and accurate advice to civil defence emergency management officials, the science system needs to be able to have access to high quality tools, systems and expertise.
NeSI is part of the infrastructure behind the science response. The time taken to produce a sufficiently high resolution model can mean the difference between operational decisions—such as flight cancellations—being well informed or being made in the dark. The ability to quickly model ash fall enhances New Zealand's ability to prepare for and respond to its volcanic risk.