")
Understanding biomolecular enzymes to develop new therapies
PhD candidate Eric Lang is deepening our understanding of the Shikimate pathway, which may lead to therapies that affect bacteria, but not humans
Subject:
A team of meteorologists at NIWA, led by principal scientist Dr Michael Uddstrom, have been looking into how to improve weather forecasts for New Zealand. The team has been developing a new numerical weather prediction model for the country that will be much more capable of representing the unique features of our environment, such as the geography of the Southern Alps.
Numerical Weather Prediction (NWP) is a term used to describe the use of computer modelling to predict the weather. More formally, the intention of NWP is to predict the future state of the atmosphere using data gathered from observations of its current state and the application of a set of numerical approximations to the equations of fluid dynamics and physical processes. Those processes include convection, boundary layer turbulence, radiation, cloud physics, microphysics and orographic drag.
A NWP forecast is thus made possible by four broad components:
For the last few years, NIWA has operated the New Zealand Limited Area Model, or NZLAM. This model is a local configuration of the UK Met Office Unified Model. In NZLAM, New Zealand and its surrounding seas are divided onto a 324x324 horizontal grid, while the atmosphere is split into 70 vertical levels, from the surface to approximately 80km above sea level. Each horizontal grid square is about 12km (0.11 degrees) in length.
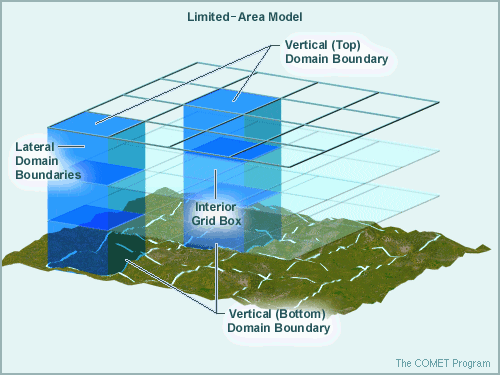
Figure 1 An illustration of an NWP Limited Area Model domain showing how it is discretized into a horizontal (x, y) grid, vertical layers (z) - which near the surface are terrain following, but become smoother with height. (Courtesy of the UCAR COMET programme.)
Observational data for New Zealand’s atmosphere is typically provided via satellite, in particular from instruments on board NOAA-14 and NOAA-15. Additional data are provided from ship, airplane readings and weather stations from around the country.
These data are then inserted into the model using a process called data assimilation, where the model state from a previous forecast is altered to include the new observations and becomes the initial state for the next forecast. During the course of this assimilation process, a number of processing, data cleansing and bias correction steps are carried out to ensure no erroneous data is included that could lead to problems running the model. For the NZLAM, the initial conditions comprise 86 different meteorological variables, with 18 of those having values covering the lowest 80km of the atmosphere, 4 containing data for the 2m of soil directly below the surface and the rest being valid only at the surface.
NeSI is essential for the fourth component of NWP. The computing platforms, in particular the synergy of many processors, large amounts of memory and extremely fast interconnects, enables a 2-day forecast to be produced within minutes. On FitzRoy, a typical 2-day NZLAM forecast takes approximately 11 minutes to complete, using 256 processors across 8 nodes.
A finer grid enables the model to more accurately represent the topography of the region of interest and the surface processes occurring at the smaller spatial scales. Unfortunately, as the number of grid points increases, so does the number of calculations and the communication overhead that is imposed between each region to progress to the next step in the simulation.
While the process of developing a new model may sound simple – simply divide the area of interest into smaller pieces – there are a number of factors which make this an extremely challenging task. For example, the numerical approximations, or parameterisations, of physical processes that could be applied at the 12km scale in NZLAM may no longer be applicable or even needed at these finer scales. Thus new parameterizations may be required, or in the case of convection, it may be possible to dispense with the need to use a parameterisation scheme altogether and explicitly model this process. Going one step further, for groundwater and soil temperature calculations to be accurate, a new land surface process model which is coupled to the NWP model, is used.
The data assimilation and observation processing techniques must also be developed to copewith the additional detail that the finer resolution NWP models are capable of producing. All of these changes and developments are verified against actual observations and compared against forecasts from the coarser resolution forecasts over a series of case studies to identify any local bias in the model and ensure that there really is a benefit to using the finer resolution.
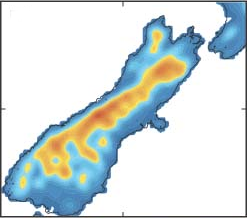
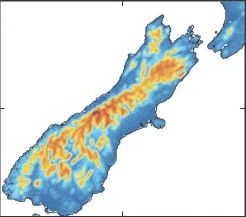
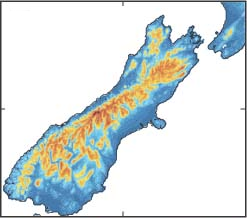
Figures 2-4 Images showing how the topography of the South Island as used in an NWP model varies at horizontal resolutions of 12km (left), 4km (centre) and 1km (right) horizontal resolutions. At 12km, resolution, Mt Cook has a peak height of just 1675m (cf 3754m in reality) and the Southern Alps is a continuous ridge, while at 1km, Mt Cook now stands at 2820m above sea level and the glacial valleys, fjords and basins that litter the Southern Alps can be better resolved.
In parallel to NZLAM, NIWA has recently begun running a 1.5km resolution NWP model called the New Zealand Convective Scale Model (NZCSM). This model uses initial conditions interpolated from NZLAM onto a 1.5km grid. This first guess is then adapted to match up-to-date observation data. The domain is divided into a horizontal grid of 1200x1350 1.5x1.5km squares and has 70 vertical levels that cover the lowest 40km of the atmosphere. This resolution produces a model 15 times larger than NZLAM computationally, but still only covers a much smaller geographic area. It also requires a lot more computational power to produce a forecast in a timely manner. Currently, a 36 hour forecast by NZCSM takes 130 minutes to complete using 810 processors spread across 13 nodes of FitzRoy. The resolution difference between those two models means that while they will both be able to predict which cities will be affected by storms, NZCSM should be able to predict which suburbs will be heaviest hit.
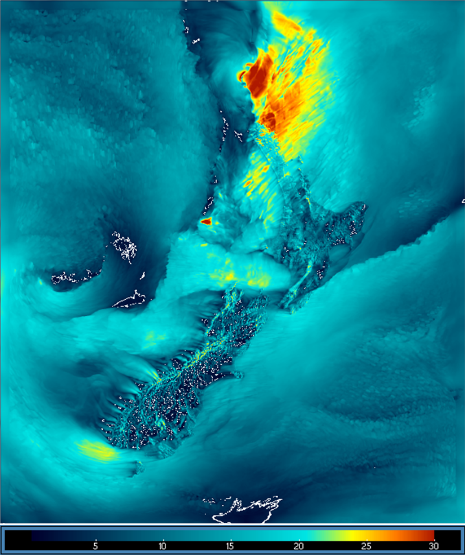
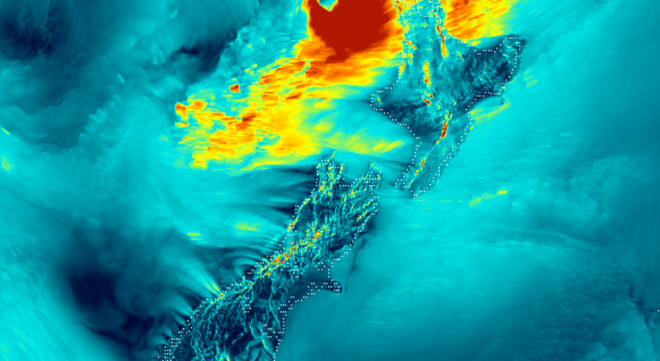
Figure 5 10m surface wind gusts showing outflows from South Island fjords.
One of the biggest challenges in NWP is verification. While forecasts at finer resolutionsmay look more detailed and realistic, that does not mean they are necessarily more accurate. At NIWA, a lot of effort is currently being put into ensuring that forecasts from NZLAM and NZCSM are properly verified against local observations of key meteorological variables. These include precipitation, wind speed and direction, temperature, relative humidity and mean sea level pressure. Proper verification of precipitation is vital as model resolutions increase due to the greater spatial variability of the field and the effect that the local topography can play in where precipitation occurs. For this reason, effort is put into regional, rather than just location-specific verification and novel, spatially-aware verification techniques are being developed.
In its current form, NZLAM is unable to adequately resolve important features of New Zealand’s unique landscape, such as the Southern Alps. More accurately representing the geography, soil conditions and other physical processes that affect the weather will all combine to improve the accuracy of NWP in New Zealand.
As well as providing improved accuracy generally, finer resolutions also enable far better modelling of severe weather events. A mesoscale model, that is a model with a horizontal resolution of about 12km (such as NZLAM), typically relies on statistical approximation to represent atmospheric convection processes, including precipitation. At finer resolutions, atmospheric convection is able to be modelled explicitly. Coupled with improvements in the representation of the topography, this should lead to more accurate modelling of severe weather for both national and local forecasts.