Next-gen geothermal modelling for a cheap green energy future
“Use of NeSI was central to our software development. We don’t know how big models will get in the future, so we wanted to make this as scalable as possible."
Research background
Aotearoa New Zealand's response to Covid-19 has been supported by collaborative research efforts, targeted modelling, rapid genome sequencing, and access to powerful eResearch infrastructure. A diverse swath of New Zealand’s science ecosystem – including Te Pūnaha Matatini, the Institute of Environmental Science and Research (ESR), universities, Crown Research Institutes, NeSI, REANNZ, Genomics Aotearoa just to name a few – have been called into action to support an integrated response.
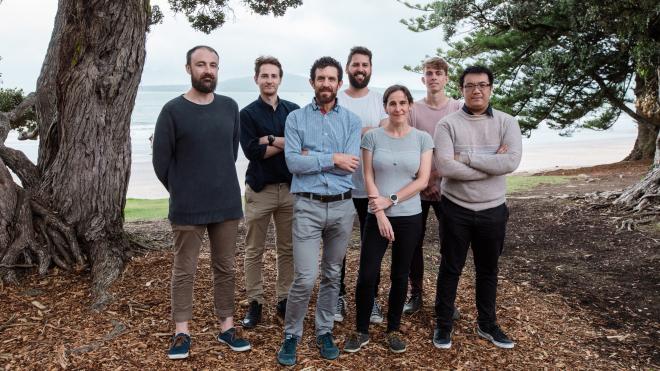
At the University of Auckland, David Wu and Oliver Maclaren – researchers in the Contagion Network Team (CNT) of Te Pūnaha Matatini's Covid modelling response – have been developing software that models the spread of COVID-19 under a range of different scenarios and interventions. Their model is one of the key modelling tools that the New Zealand government has been using to make decisions around Alert Levels and in responding to outbreaks.
Project challenges
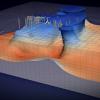
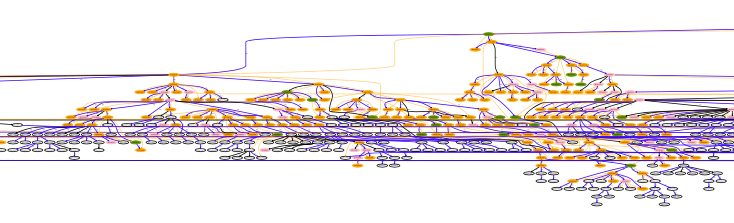
David and Oliver's code simulates random processes on an Aotearoa-specific interaction network. Each of the ~5 million individuals in the population is represented as a node, connected to other individuals through “group nodes” that represent contexts of interaction.
In addition to the transmission of the infectious disease, processes like lockdowns, contact tracing, isolation and vaccination are included in the model. As the virus spreads across the population, the size of the data structures used to store transient and historical information scales accordingly; with over ten million nodes in the network, this can easily make simulations numerically intractable. Moreover, thousands of simulations need to be run to obtain robust statistics on the multitude of interacting factors. A large contagion event can stretch a simulation beyond the point where the code can be successfully run on NeSI platforms, within the time constraints needed to produce timely advice.
What was done
NeSI research software engineers Wolfgang Hayek and Alexander Pletzer profiled and examined the memory footprint of the Python code and identified a few performance bottlenecks – an unnecessary duplication of the graph, a linear time lookup that was made constant time by using a (reverse) hashmap, and exploration of alternative graph representation libraries. A random seed mechanism was also exposed, allowing for reproducibility and benchmarking of simulations.
Main outcomes
This Consultancy project reduced the memory footprint of a single simulation from 20 GB to 11 GB and the execution time by a factor 2.7 x. This means that the researchers are able to run more cases, more efficiently on NeSI's HPC platform and provide more realistic and accurate information to policy makers who can then act on the received information.
The collaboration between NeSI and Te Pūnaha Matatini is an ongoing effort. NeSI is currently looking into making the postprocessing step more efficient.
Researcher feedback
"We have been very happy and grateful for all of the help and support of the NeSI consultancy. Getting sufficient throughout for large numbers of simulations in a limited timeframe has been essential for providing rapid advice to policy and decision makers during the COVID-19 pandemic. This often meant daily updates based on new simulations. Reducing the memory footprint of our simulations not only meant that they were able to run on more plentiful, lower memory nodes, but also reduced the overhead in the simulations. Both of these factors were a big help in the cycle of simulation – analysis – reporting – policy. Beyond the tangible performance improvements, NeSI have helped us improve our workflow and tooling, and have been an amazing source of feedback for large-scale scientific software development and deployment. We are excited about continuing to work with NeSI on improving our post-processing procedures."
- David Wu, Faculty of Engineering, University of Auckland
Do you have a research project that could benefit from working with NeSI research software engineers or a data engineer? Learn more about what kind of support they can offer and get in touch by emailing support@nesi.org.nz.