This case study originally appeared in Natural Hazards 2012, pages 38-39. Republished here with permission.
Many natural hazards can be forecast by numerically simulating fluid flow in either the atmosphere or the ocean. Typically this involves setting up a computational grid of discrete points in space covering the region of interest, on which various quantities associated with the fluid are evaluated (e.g. wind velocity, wave direction). The horizontal distance between the grid points is referred to as the model’s resolution. Equations derived from physical laws are then used to describe how these quantities evolve in time.
Why use adaptive models?
Running a forecast model on even the fastest supercomputer will face some limit in the number of grid points that can be used to produce a forecast in a usefully short time and we must decide before we start where we will need finer resolution. But for some problems we don’t know this in advance. For example a tropical cyclone may have a 50 km radius, but could occur anywhere in a region of the tropical Pacific too large to cover uniformly at a fine enough scale to resolve the details of the cyclone’s wind (and wave) fields.
One way to address this problem is to use adaptive methods to allow the spatial resolution of the computational grid to be adjusted as events unfold, allowing for fine resolution in regions where the properties of interest vary rapidly, and coarser resolution elsewhere. An example of this approach is the Gerris Flow Solver being developed in the Multi-Hazards Forecasting System research programme at NIWA. For two dimensional applications, this uses a quadtree structure to locally refine the spatial resolution of a model grid. A “parent” cell can besubdivided into four “child” cells. This process can be repeated as many times as necessary, or reversed to coarsen the grid. In three dimensions, an “octree” structure is used, refining a cubic parent cell by subdividing it into 8 cubic child cells. See grids displayed in Figure 1a.
The following sections describe how adaptive methods are being used to improve the accuracy and timeliness of wind, wave and tsunami forecasts.
Gerris applied to strong winds in Wellington
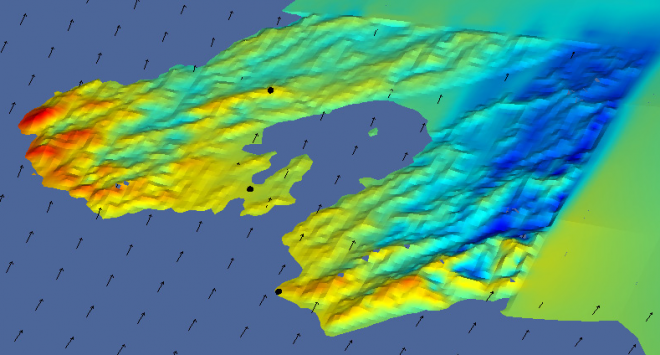
Gerris has been used to simulate a severe wind storm event that hit Wellington on 12th March 2010. A mid-afternoon southerly wind change brought with it a period of intense rainfall and extremely strong and damaging wind gusts, peaking at 122 km/h at Wellington Airport, 146 km/h at Mt KauKau and 216 km/h at Baring Head on Wellington’s exposed south coast. Using initial and lateral boundary conditions from the NZLAM-12 numerical weather prediction model (see Natural Hazards Update 2007, 20-21), Gerris was used to simulate the wind field 10m above the surface during this event at horizontal cells down to 333 m in size. The adaptive grid and much higher resolution terrain indicate that areas such as the west coast (see Fig 1b) where no observations are available also experienced very high wind speeds. The finer detail is also of benefit for highlighting residential areas that might be expected to experience higher wind speeds and thus incur greater damage than others. Using Gerris in this way is an inexpensive method for obtaining highly localised wind forecasts at resolutions not yet computationally affordable with a full-scale numerical weather prediction model.

Figure 1a - Map showing the initial t = 0 s Gerris grid configuration in the horizontal and vertical, and the high resolution terrain, coloured according to height above sea-level. The resolved terrain resolution decreases with distance away from the centre of the domain (Wellington Airport) and the Airport, Mt Kaukau and Baring Head are depicted by white dots in the image.

Figure 1b - Surface wind speed and wind direction vectors over the Wellington region 11 hours into the Gerris simulation. The image clearly shows the west coast experiencing much higher wind speeds than the 3 observation stations, Baring Head, Mt Kaukau and Wellington Airport, that are depicted by black dots.
Indian Ocean Tsunami
In December 2004, a fault rupture off the Sumatra coast produced damaging tsunami waves throughout the Indian Ocean basin. Simulation of such an event requires a model domain covering a large spatial extent, but also needs to resolve the wave front, and the topography it interacts with, at much finer scales, so the adaptive Gerris model offers a very efficient way of simulating this event. Figure 2 illustrates the wave elevation field and the corresponding adaptive mesh at 2 hours and 3.5 hours after the initial fault rupture. The model starts with a very coarse resolution, but refines the mesh around the advancing wave fronts, using a dynamic terrain reconstruction procedure to create the needed bathymetry “on-the-fly”.

Figure 2 - 2004 Indian Ocean tsunami at t = 2 hours (top) and t = 3.5 hours (bottom). The left column shows wave elevation (crests are red and troughs are blue). The right column shows spatial resolution of the adaptive mesh, ranging from 101 nautical miles (dark blue) to 0.8 nautical miles (dark red).
After 2 hours, the wave front has just reached Sri Lanka, so that the eastern side of the island is resolved at the maximum resolution (0.8 nautical miles) while the western coastline still uses the much coarser resolution (50 nm). After 3.5 hours, the wave front reaches the Maldives (previously unresolved) and wave reflections off the eastern coastline of Sri Lanka are also evident.
The complex individual wave fronts due to the staggered fault rupture and initial dispersion are also tracked individually at high resolution. Some areas (e.g. the dark blue patch south of the Aceh Peninsula in the top right of Fig. 2) have already been traversed by the wave fronts and have returned to coarser resolutions, appropriate to resolve the smoother elevation field there.