
Examining the Earth’s electro-magnetic field in 3D
Researchers achieve 80 fold speedup thanks to hardware and support available through NeSI
Subject:
The New Zealand Wind Engineering Consortium has been investigating how to reduce the vulnerability of New Zealand’s built environment to wind damage by improving procedures for estimating design wind speeds.
The consortium consists of an informal group of scientists from NIWA, GNS Science, Opus Research and the University of Auckland Engineering Department and received funding from the Natural Hazards Research Platform to conduct the research.
Hill shape has a huge effect on windspeed. The shape of a hillside can increase the wind’s speed by three compared to nearby flat terrain. This effect is calculated with what is known as a hill-shape multiplier. It is the ratio of wind speed over a hill divided by the wind speed at a nearby, upstream flat site. The ratio is very important when considering wind action on buildings and structures located on hilly sites.
Being able to accurately predict wind speeds will mean a more resilient community. Storms regularly cause severe damage. New Zealand’s hilly geography, the location of its urban areas environment and the country’s location within the ‘roaring forties’ means that wind loadings are an important consideration when it comes to our building codes.
During February 2011, the Wellington region withstood an 18-hour period of severe gale force northwesterlies. The event cut power to 1,000 homes. Wind speeds were measured along a line of anemometers running from west to east across Belmont Park (Fig. 1). The speeds at the top of these hills have been compared with speeds observed at a nearby site unaffected by the hills. This allows the researchers to estimate hill-shape multipliers.
As well as using actual measurements, the event has been simulated in a number of ways: computational fluid dynamic (CFD) computer modelling using Gerris (Fig. 2), wind tunnel testing (Fig. 3), and an empirical model (WASP).
These simulations can be used to evaluate the accuracy of the current loading standard. The current standard provides a method for estimating wind loading. The results of the evaluation are presented below.

Figure 1 - Location of the anemometers in Belmont Park with an elevation profile.

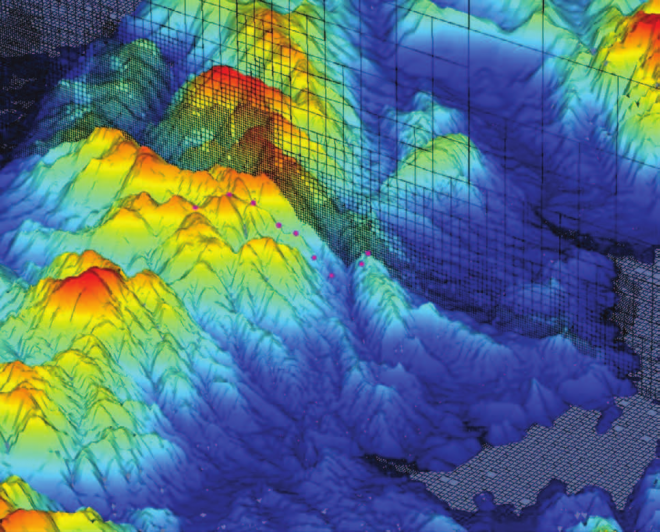
Figure 2 - CFD model GERRIS topography (highest peak in foreground ~ 400 m), mast locations (purple dots 1 to 9 from left to right) and adaptive grid along a North-North West -SSE cross-section through Belmont Park (northern half of the domain) viewed from the North East.

Figure 3 - 1:2000 wind tunnel model of the Belmont terrain from the North West. The anemometer locations correspond to the numbered red dots running up the ridgee in the centre of the picture.
Applying the current loadings standard resulted in a variance from measured values by as much as 40 percent.
While the results from CFD and wind tunnel modelling agreed quite well with the measured hill-shape multipliers—mostly within 15 percent and frequently within 5 percent—there was a large variation from the current loading standard.
Applying the current loadings standard resulted in a variance from measured values by as much as 40 percent. Estimates based on the loading standard were also found to vary considerably, up to 40 percent, depending on the interpretation of the loadings standard by different operators.

Figure 4: Hill-shape multiplier at 5 m at mast location for a wind direction of 345° as determined by measurements (black), CFD - Gerris (red), Wind Tunnel (brown), CFD - WASP (green) and AS/NZS 1170 loadings standard (blue).
Further field studies and modelling for a greater range of wind speeds, directions and mast heights will be made over the next year with the aim of improving the wind loading standards to make them more relevant to New Zealand conditions.
This case study has been adapted from the original produced within the Natural Hazards Research Management Platform 2012 annual report.